You are here
Census Bureau Report on Poverty and Health Insurance Coverage
The Census Bureau recently released their annual report on poverty and health insurance coverage in the United States, “Income, Poverty, and Health Insurance Coverage in the United States: 2009”. The report examines the results of a bureau survey called the Current Population Survey Annual Social and Economic Supplements (CPS ASEC).
Highlights
Median income in America declined by $335 between 2008 and 2009, from $50,112 to $49,777. This change was not “statistically significant.”
The poverty rate in 2009 was 14.3 percent, up from 13.2 percent in 2008. This is the highest rate since 1994.
Nearly 51 million people in the country were without health insurance during the entire year. This represents nearly 17 percent of the population. Additionally, the number of people with health insurance decreased for the first time since the Census began tracking insurance coverage.
The Census report documents the dramatic impact of the recent recession on American society by showing how changes in income, poverty and health insurance coverage have impacted the population by demographic group.
The Bureau of Labor Statistics, the Social Security Administration, and the Census Bureau all provide statistical analyses of economic activity and demographic changes in the United States. This information helps inform policymakers and the public about the condition of the American economy and needs of our people. Much of the data are collected through surveys, which use a complex set of statistical techniques in their measurements.
What is the poverty measurement?
Before going into detail on the contents of the report, it is worth pausing briefly to discuss what the poverty measurement is. Why do we have one? And, where did it come from?
The current poverty measurement is based on the work of Social Security Administration statistician Mollie Orshansky, who, in 1963, developed a method of calculating poverty. In the late 1950s and throughout the 1960s, as increasing industrial productivity failed to raise living standards for certain segments of the population, interest in social welfare programs grew. Since measures did not exist to capture the information, economists and the government had trouble understanding who was poor or how many poor people there were.
1 Median income means that half of American incomes are higher than the figure and half of all incomes are below that figure.
2 Statistical significance is a mathematical term that indicates whether an observation about a sample (whether it be a relationship or difference) can be said to occur in the population as a whole, rather than occurring randomly.
Orshansky set about developing her method largely as an intellectual exercise, and it was released as “Children of the Poor” in a publication called Social Security Bulletin in 1963. Her actual process was somewhat complicated but effectively combined two data sets that were already available – Census data on income and food plan data from the Agriculture Department (where Orshansky had worked). In 1955, the Agriculture Department conducted a survey of food consumption patterns to develop food plans, which served as a gauge what was required to provide adequate nutrition to families at different income levels. Orshansky used food data because they were the only extant, generally accepted data on living essentials. She made adjustments for family size and multiplied by three because the 1955 survey had found that for families of three or more, food costs accounted for one-third of income, on average. By comparing this metric to income data found in Census surveys, Orshansky could determine how many people lived with a bare minimum of resources. Families who had to spend more than one-third of their income to provide themselves with a minimally-acceptable diet were considered poor.
Though the poverty level has been modified (notably to adjust for inflation rather than increases in the cost of food), it remains the official threshold for poverty today . It is based on a 40-year old formula that reflects on 50-year old patterns of consumption. It does not take into account relative changes in prices over time (housing prices and health care costs have increased faster than food and not represent a greater share of consumption) or geographic variation (what $1 buys you in New York City is very different from what $1 buys you in central Iowa). Recently the Census and partner statistical agencies throughout the government have started to develop a supplemental poverty measurement that will attempt to augment the current framework by taking some of these factors into account. Their efforts will not alter official levels of poverty or eligibility for government assistance programs.
Income and poverty statistics
The Census report provides insight into the impact of the recent recession on particular regions and demographic groups. For example, even though the overall median income did not fall dramatically between 2008 and 2009, the Census data show that some groups have been more deeply affected than others. The following groups saw declines in their median income:
- Black households
- Non-Hispanic white households
- The Midwest
- The West
- Residents of suburban areas
Some of the data reveal interesting information about income disparities. Households in cities saw increases in median income at the same time that the urban poverty rate increased – which may mean that these income increases are concentrated among the employed and better-off, and not evenly spread. Alternatively, it might suggest that the recession has had a disproportionate impact on urban areas, which are more vulnerable to economic shocks because of their economic diversity.
3 There are actually two measurements of poverty currently used by the federal government. The Census Bureau maintains the poverty thresholds for statistical purposes (and these are discussed in this report) and the Department of Health and Human Services determines the poverty line, which determines eligibility for certain federal programs. The figures are not substantively different.
Men and women (15 years and older) who worked full-time throughout the year saw increases in median earnings. Unsurprisingly, “the increase in poverty among workers was driven almost entirely by those who worked less than full-time, year-round”. Within the working population, the recession has had the greatest impact on the un- or under-employed. But at the same time, the recession appears to be affecting populations whose educational and professional backgrounds have traditionally believed to have been more or less “recession proof:” male professional college graduates saw declines in median income in 2009.
As they have been for many years, certain racial groups are also disproportionately represented in the poverty statistics. The poverty rate for blacks, already an alarming 24.7 percent, increased to 25.8 percent. Similarly, the Hispanic poverty rate increased from 23.2 percent to 25.3 percent.
And, of course, the most vulnerable feel the recession’s impact most directly. 20.7 percent of the population of children under 18 was living in poverty in 2009. “Children comprised 35.5 percent of people in poverty but only 24.5 percent of the population”. Senior citizens saw the lowest poverty rate - 8.9 percent, which is likely due to the effects of Social Security. Additionally, senior citizens were the only age group not to see an increase in their poverty rate: senior median income increased between 2008 and 2009.
Health insurance coverage
The health insurance statistics also reveal troubling, but anticipated changes in coverage over the past year. These losses were expected because so many Americans receive health insurance through their employers. Those who lose jobs often lose coverage, as well. The number of uninsured increased by 4.4 million people from 2008 to 2009. The report also only tracks individuals who had no health insurance throughout the entire year and therefore does not capture those who have churned in and out of the health care system as they lost or gained jobs that provided health insurance coverage. Thus the statistic is limited in its ability to capture gaps in insurance coverage and underinsurance. At the same time, the Census Bureau expects that coverage is probably underreported in the survey, since respondents may conflate being uninsured for a short period of time with being uninsured for the entire year.
Details on insurance coverage worth noting include:
- 10 percent of children under 18 lacked insurance coverage; 15.1 percent of children in poverty (who most likely qualify for CHIP or Medicaid) remained uninsured.
- 12 percent of blacks were uninsured.
- 32.4 percent of Hispanic families were uninsured.
The report also indicates that the ranks of those insured through government programs have swollen to 93.2 million people, from 87.4 million in 2008. That is roughly 1 out of every 3 Americans. Of these, 47.8 million people were covered by Medicaid, an increase of 5.2 million. Because Medicaid is a means-tested program (a person’s eligibility is determined by their income relative to the poverty threshold), it is designed to act counter-cyclically and should experience increases in enrollment during economic downturns. But the report notes that this is the highest rate of Medicaid coverage since 1987, when the census first started tracking insurance coverage. Should employment numbers fail to rebound over the next several years, Medicaid enrollment might remain high. The eligibility levels are currently frozen, however they are expected to increase within the next few years under the Affordable Care Act. All of this suggests that state and federal budgets may be even further strained by increased Medicaid costs due to continued high enrollment levels.
What does this all mean?
What are we to make of this grim data? The broad increases in poverty and the decreases in insurance coverage, especially as they seem to impact certain groups disproportionately, suggest that this recession has had a particularly dramatic and lopsided impact on Americans. The report also suggests that, even though the recession may be officially over, that its effects continue to be felt and may be with us for some time (especially if unemployment rates remain high). It also calls into question the effectiveness of the social safety net: why aren’t potentially Medicaid-eligible children enrolled in the program? Can we afford that additional cost in an era of tight budgets? Are the unemployed who are falling into poverty not taking advantage of unemployment benefits, or are these benefits inadequate to keep them from falling into poverty? These are questions that are difficult to address in a country wracked by economic uncertainty.
But they are important questions that we all should reckon with, since poverty impacts a larger segment of the country than we might think. The report notes that nearly one-third of the population experienced a spell of poverty that lasted 2 months or longer between 2004 and 2007. This is a sizable chunk of Americans. Any future fiscal action will have to take into account the most vulnerable among us.
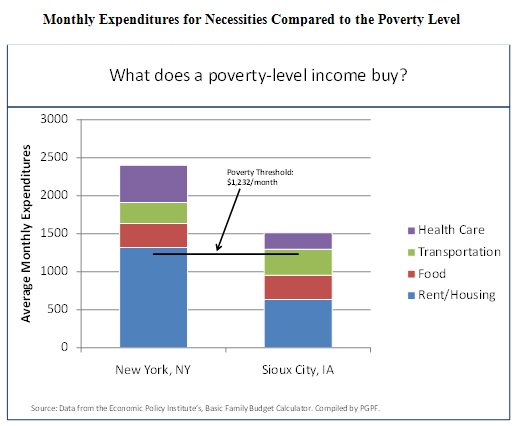
To put the poverty thresholds into perspective, PGPF looked at how a single parent with one child whose income equals 100 percent of poverty would fare each month. We used the Economic Policy Institute’s “Basic Family Budget Calculator,” which develops budgets by family size for various regions. The calculator estimates average expenses based upon surveys conducted by federal agencies. A single parent in New York, whose annual income is equal to the poverty threshold, makes around $1,000 less than the estimated amount required to meet the average costs of rent, transportation, health care, and food; a Sioux City single parent is just under $300 short.
4 Found at http://www.epi.org/content/budget_calculator/