
You are here
CBO’s Latest Budget Projections: A Deteriorating Fiscal Outlook
Introduction
The Congressional Budget Office (CBO) released its latest Budget and Economic Outlook last week. According to CBO, the fiscal condition of the United States has deteriorated since its last report issued in August. Highlights of the new ten-year budget “baseline” include projections of:
- A slower economic recovery;
- An unprecedented deficit of $1.5 trillion for this fiscal year (FY), which, at 9.8 percent of the economy or gross domestic product (GDP), is only slightly below the post-World War II record of 10 percent recorded in FY 2009;
- Compared to August, an increase in cumulative deficits over the 2011-2020 period of more than $1.4 trillion, assuming current laws are maintained. When likely changes to current law (extension of the tax cuts, maintenance of Medicare’s physician payment rates, and a phase-out of war spending) are assumed, cumulative deficits are projected to be more than $3 trillion higher;
- Permanent cash flow deficits for Social Security;
- A doubling of spending for health care programs over the decade; and
- Interest costs that will equal non-defense discretionary spending in 2019.
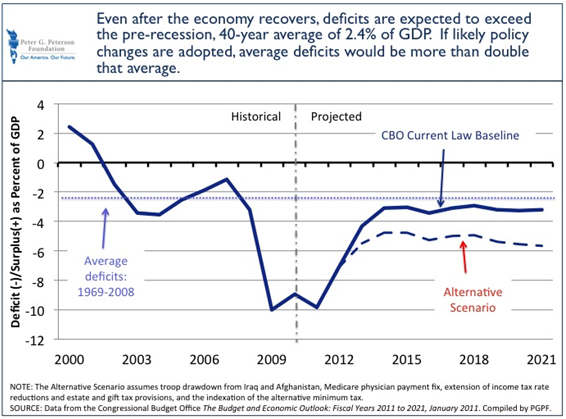
The new baseline sets the stage for this year’s budget deliberations. It does not represent CBO’s prediction of the future path of the budget. Instead, it establishes a neutral benchmark against which the budget proposals of the President and the Congress will be measured. This latest baseline reflects changes in the budget outlook that largely result from the Tax Relief, Unemployment Insurance Reauthorization, and Job Creation Act of 2010 (2010 tax act), which was enacted in December, as well as more pessimistic assumptions about the economy. But even after the economy recovers, CBO projects that deficits will remain higher than the average levels seen before the financial crisis and the recent recession (see Figure 1).
Figure 1. Federal Deficits as a percent of GDP
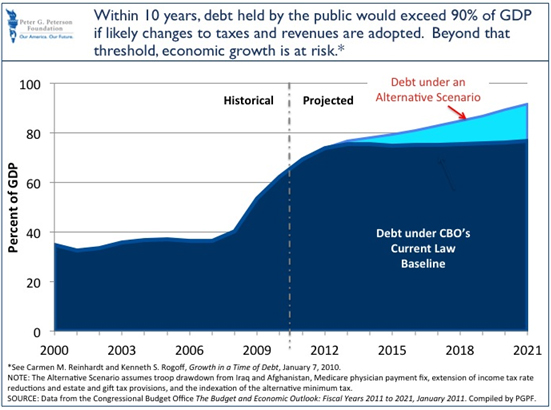
The federal debt, or the cumulative total of the government’s deficits and surpluses, will also grow faster than had been projected in August. By 2021, under the current law scenario, the debt held by the public is projected to be 77 percent of the country’s economic output, or gross domestic product (GDP) (see Figure 2). Under alternative assumptions, however, that number rises to over 90 percent of GDP.
Figure 2. Debt Held By the Public
Economic Outlook
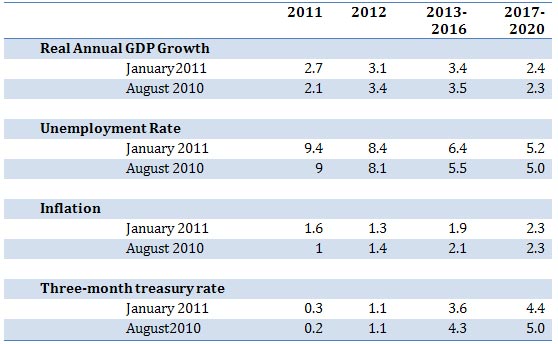
The economic outlook has deteriorated since CBO’s August report (see Figure 3). CBO now projects that the U.S. economy will continue to struggle with high unemployment and sluggish growth for several more years. The pace of this recovery is significantly different than the path to recovery following previous recessions.
CBO expects unemployment to remain very high despite projected economic growth in 2011 driven by the tax cuts passed at the end of 2010. During the recent recession, the U.S. economy lost 7 million jobs. So far, the economy has only added back 70,000 jobs. If CBO’s new projections are accurate, the economy will not recover all of the jobs lost, and unemployment will remain above the normal 5.3 percent level, until 2016.
CBO believes there are several possible causes of the high levels of unemployment. These are:
- A lack of demand for workers;
- A mismatch between the skills of the unemployed and the requirements of employers looking to hire; and
- An inability of those who are underwater in their mortgages to relocate to find employment.
In addition to these factors, the extension of unemployment insurance may contribute to higher unemployment rates. It may have encouraged some jobless people to stay in the work force who, without extended unemployment benefits, might have dropped out of the labor force altogether, retired, or applied for Social Security disability benefits. Or, the extended benefits may have allowed some people to search less intensively for work than they would have if their benefit eligibility ended sooner.
Given high unemployment and other indictors of unused resources in the economy, CBO projects a low level of inflation for the next five years. But with interest rates on three-month Treasuries projected to be lower than inflation in 2011 and 2012, investors in short-term U.S debt risk actually losing money.
Figure 3. Comparison of CBO Economic Assumptions: January 2011 and August 2010
SOURCE: Congressional Budget Office, The Budget and Economic Outlook: Fiscal Years 2011-2021, January 2011.
Health Care
CBO projects that federal health spending will continue to be one of the fastest-growing areas of federal spending, increasing at an average rate of 7 percent per year over the next decade. In contrast, over that same time, GDP is expected to grow at the rate of only 2.4 percent per year.
The new baseline incorporates provisions of the 2010 health care reform act (the Patient Protection and Affordable Care Act—or PPACA) that would expand Medicaid, provide subsidies for health insurance coverage, and, if implemented and maintained as designed, restrain the growth of Medicare costs.
Medicaid
Medicaid’s growth is projected to be responsible for 40 percent of the growth of federal health spending over the next decade. The 2009 stimulus bill (the American Recovery and Reinvestment Act of 2009—or ARRA) and other legislation provided states with a temporary increase in Medicaid matching funds to help offset the impact of the recession. As the higher federal match expires, CBO estimates that Medicaid will show little growth this year and will decrease in 2012. However, beginning in 2014, the expansion of eligibility for Medicaid included in the PPACA will begin. CBO projects that enrollment will grow from its 2011 high of 68 million people to more than 97 million by the end of the decade. With the federal government responsible for almost all of the cost of that expansion, Medicaid will become the fastest-growing federal health program. CBO estimates that spending will increase at an average annual rate of 9 percent from 2014 to 2021.
Medicare
Medicare, which has historically grown faster than Medicaid, is projected in the baseline to be responsible for 30 percent of the growth of federal health spending.
Under current law, Medicare spending is projected to grow about 7 percent per year on average between 2013 and 2021. However, this projection reflects possibly unrealistic expectations about program growth. Under current law, Medicare physicians will face a 28 percent reduction in fees in January 2012 as a result of the program’s “Sustainable Growth Rate” payment formula. Lawmakers have overridden these reductions every year since 2003; if they do so again, CBO projects that Medicare outlays would increase by an additional $250 billion over the decade. Additionally, the PPACA included provisions that would constrain the growth in payments to other health care providers that many health policy experts believe are not sustainable. In addition, critics have challenged new activities—including the Independent Payment Advisory Board and the Medicare Innovation Center—that are intended to reduce the growth in Medicare costs.
Health Insurance Exchanges
Subsidies for people who enroll in new health insurance exchanges, together with operating costs for the exchanges, make up the lion’s share of the remainder of federal health spending growth; outlays may approach $100 billion by the end of the decade. CBO projects that around 7 million people will receive health insurance coverage through exchanges when they go into operation in 2014, and that the program will grow to 18 million participants by the end of the decade.
Social Security
Social Security remains the largest single program in the federal budget. In 2010, the program paid over $700 billion in benefits to retirees, surviving spouses and their families, and those claiming the disability benefit. This represented about 20 percent of all of the money spent by the federal government that year.
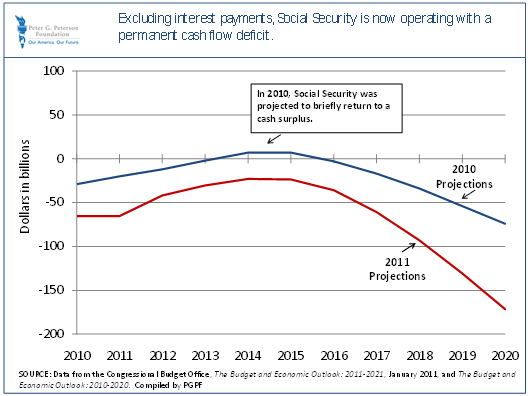
Compared to previous CBO estimates, Social Security’s long-term position has worsened. Social Security is now operating with a cash flow deficit that CBO projects is permanent (See Figure 4). In other words, the program pays more in benefits than it brings in by way of payroll taxes, and the program is not expected to operate with a cash surplus again. The program is expected to run a cash deficit of approximately $45 billion and continue running cash deficits permanently. This contrasts with CBO’s 2010 projections, which estimated that Social Security would generate small cash surpluses in 2013, 2014, and 2015 before running permanent deficits beginning in 2016.
There are a number of factors that have contributed to the decline in Social Security’s long-term financial outlook. The after effects of the financial crisis and the slow economic recovery are still placing a heavy burden on the program’s long-term solvency. The program saw increased numbers of beneficiaries in 2010. Facing a tough labor market, more people filed for Social Security benefits and left the work force. CBO reports that the number of people receiving Social Security Disability Insurance benefits increased by almost 5 percent in 2010—much higher than in the past, even during recessions. As high unemployment continues through 2016, the program’s revenue base will also be affected.
Figure 4. Social Security Cash Flow Projections
Social Security is financed on a pay-as-you-go basis through a payroll tax. Normally, this tax is levied on wages up to the taxable maximum at a rate of 12.4 percent. Currently, the payroll tax covers the first $106,800 of wages. Employees pay half of the tax and employers pay the other half. The 2010 tax act contained a provision that reduced the employee share of the payroll tax from 6.2 percent to 4.2 percent in calendar year 2011. CBO estimates that the payroll tax cut will reduce Social Security’s revenues by $70 billion. However, transfers from general revenues to the Social Security trust fund will make up the shortfall. Though the temporary payroll tax cut will provide direct tax relief to workers, this policy represents a break in the connection between Social Security benefits and payroll contributions.
All Other Spending
Defense discretionary spending
Growth in defense spending accounts for almost all of the projected increase in discretionary—or annually appropriated—spending in 2011. Defense spending increased by 5 percent, or about $32 billion. That represents a slower increase than the 9 percent average growth rate of the last decade. Nearly all of last year’s growth was driven by operations and maintenance and personnel costs, the two largest components of the Pentagon’s budget. Only a quarter of the growth resulted from continuing operations in Afghanistan and Iraq.
The CBO baseline does not reflect anticipated changes in funding this year for war-related activities or planned future adjustments in the Iraq and Afghanistan missions. It assumes current funding levels continue in real terms until the end of the decade, even though we continue to reduce our commitments in Iraq and troop withdrawals in Afghanistan are scheduled to begin later this year. Current projections call for $1.8 trillion in war-related funding over the next decade. CBO constructs a scenario that reduces active-duty troops, which reduces projected outlays by $1.1 trillion over the next ten years.
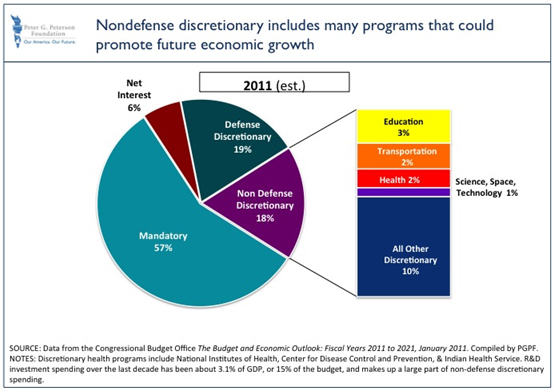
Nondefense discretionary spending
Nondefense discretionary spending, like defense spending, results from annual appropriations legislation. The programs in this category of federal spending, representing 18 percent of the budget for 2011, are some of the most visible (other than individual benefit programs), and include the Congress, the White House, the Supreme Court, national parks, law enforcement, and programs that could help strengthen the future economy including education, research and development, and investments in physical infrastructure (see Figure 5).
Figure 5. Nondefense Discretionary Spending
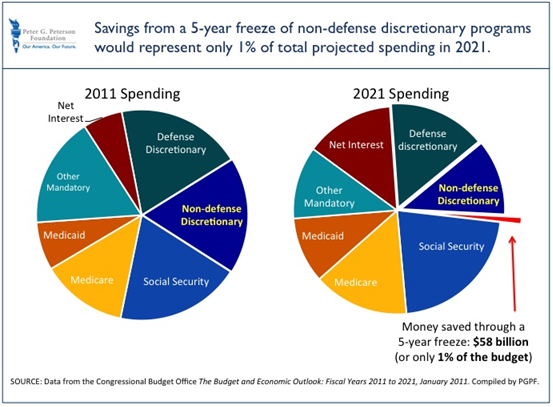
Last year, the President announced a three-year freeze on a section of the budget he called “non-security discretionary spending,” which is very similar to the non-defense discretionary category shown in Figure 5 above (though the President would exclude programs like Homeland Security from the freeze). This year, in the State of the Union Address, he pledged to extend the freeze for an additional two years. This has been one of the first concrete steps taken since the recovery to address our future fiscal challenges. However, the effect is limited and much work will remain to be done (See Figure 6).
Figure 6. Projected savings from a five-year freeze of nondefense discretionary programs
Taxes
Compared to CBO’s previous estimates, the new baseline includes significantly lower revenues over the coming decade. Revenues are projected to be $419 billion lower in 2011, $398 billion lower in 2012, and $1.9 trillion (or 5 percent) lower for the 2011-2020 period. The projected decline in 2011 revenues is the main reason behind the increase in this year’s deficit from $1.1 trillion to $1.5 trillion.
Over $700 billion of the projected decline in revenues is due to recent legislation, specifically the 2010 tax act. That law extends all of the Bush income tax cuts and the estate tax through 2012, and reduces employees’ Social Security payroll taxes by 2 percentage points for 2011.
CBO attributes $960 billion in revenue decreases over the next 10 years to the slow economic recovery, which has resulted in slower employment, lower incomes for individuals and corporations, and slightly higher inflation over the next decade than CBO previously projected. A smaller share of the revenue reduction, $210 billion over the decade, is due to technical changes in estimates.
These projections might still be optimistic despite being lower than CBO’s previous estimates. CBO’s baseline outlook shows that receipts from individual income taxes are expected to grow rapidly in the coming decade, from 6.6 percent of GDP in 2011 to 11.2 percent of GDP in 2021. That revenue growth assumes that the 2010 tax act provisions will expire as scheduled at the end of 2012 and that the alternative minimum tax (AMT) will not be patched again to reflect inflation. Under CBO’s alternative scenario, which assumes extension of the individual income tax rate cuts and gift and estate taxes beyond 2012, and continuing indexation of the AMT, revenues would be $4.6 trillion lower over the 2011-2021 period than revenues in the current law baseline.
CBO’s report highlights the issue of tax expenditures, or the exemptions, credits and deductions that result in a loss of revenues the government would otherwise collect. In 2008, these expenditures reduced gross taxable income by a third, from $8.4 trillion to $5.7 trillion. CBO estimates that foregone revenues from the largest individual tax expenditure, the exclusion of employer-sponsored health insurance from taxable income, will total $659 billion over the 2010-2014 period. In the same period, the exclusion of pension contributions and earnings will result in $597 billion of lost revenue, and the mortgage interest deduction will result in $484 billion in lost revenues.
The Cost of Economic Recovery
The federal government undertook an array of actions to help the economy recover from the 2008 financial crisis and deep recession:
- The Troubled Asset Relief Program, or TARP, included most of the industry bailouts. There have been unexpected levels of return on investment in the TARP program—$110 billion was paid back to the government in 2010—and CBO now estimates its final cost to be only $25 billion, down from the $99 billion estimate made a year ago.
- The 2009 stimulus package, or ARRA, was a sweeping bill, and the Congressional Budget Office estimates that it will have added $726 billion to the deficit from its enactment to the end of 2011. The federal government will spend most of the money from ARRA by the end of 2011, but its fiscal impact is being replaced by the 2010 tax act.
- CBO estimates that the 2010 tax act, which included tax cuts and an extension of unemployment benefits, will cost $390 billion in 2011, more than offsetting the drop in ARRA spending from its 2010 level. Over the course of ten years, the 2010 Tax Act will increase deficits more than ARRA did (see Figures 7 and 8).
Figure 7. Comparison of Stimulus Action
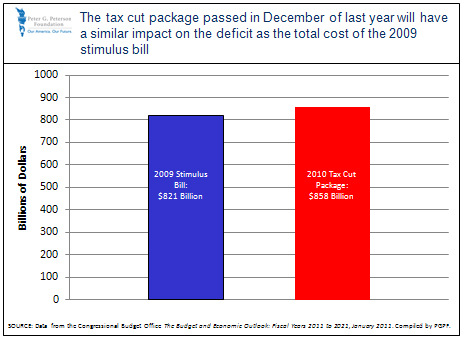
Figure 8. Deficit Impact of Stimulus Legislation, in billions of dollars
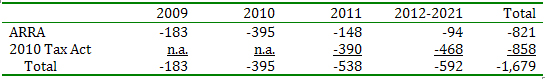
NOTE: Negative amounts reflect increases to the federal deficit.
SOURCE: Congressional Budget Office, The Budget and Economic Outlook: Fiscal Years 2011-2021, January 2011.
A Note about Federal Debt
The federal debt is made up of two parts: intragovernmental debt and debt held by the public. Intragovernmental debt is comprised of mostly nonmarketable Treasury securities held by federal trust funds, like those of Social Security and Medicare, and other government accounts. Debt held by the public is comprised of marketable Treasury securities held by both domestic and foreign private investors. “Gross Federal Debt”—which is the number that appears on the “Debt Clock” —is the sum of both debt held by the public and intragovernmental debt. Almost all of the gross debt is limited by the statutory debt limit that policy makers will have to raise in a few months (see Figure 9).
Figure 9. Projected Federal Debt Levels

Debt held by the public has a direct impact on the economy, and is thus the number we pay closest attention to. When the federal government borrows, it may use funds that might have been available for private uses, thus potentially “crowding out” productive investment that would help the economy grow.
In addition, the government must use its resources to pay interest on its borrowing instead of using those funds for other public purposes such as education, R&D, or physical infrastructure that could strengthen the future economy. (The “net interest” line in the budget is the interest paid on the debt held by the public: the interest payments on the intragovernmental debt flow from one government account to another and so are netted out.) Interest rates are currently at an historic low—three-month rates are close to zero, while they hovered at around 8 percent as recently as 1990. Already, interest costs are the fastest growing line item in the federal budget over the next decade. The interest cost on our debt would increase dramatically if rates rise in the future.
While debt held by the public is projected to rise indefinitely into the future, intragovernmental debt can only get as large as the trust funds within the government from which it is borrowing. Both the Social Security and Medicare trust funds—by far the two largest holders of intragovernmental debt—face long-term solvency issues. In fact, this report is the first to project indefinite cash-flow deficits in the Social Security trust fund. In addition, Medicare’s Disability Insurance and Hospital Insurance trust funds will be exhausted in 2017 and 2021, respectively. Future deficit spending will no longer be offset by the surpluses of these programs. Absent major policy changes, we will need to increase our debt held by the public as the two entitlement programs draw upon their trust funds to continue to support themselves.