
You are here
CBO Releases the 2010 Long-Term Budget Outlook
Overview
In its new report, The Long Term Budget Outlook, the Congressional Budget Office (CBO) provides two projections of the nation's fiscal future over the next 75 years: one based upon laws currently on the books; and one that reflects selected changes to those laws that lawmakers are widely expected to make. The first, which CBO calls the "extended baseline," shows that revenues and non-interest spending would be almost in balance over the next 75 years. However, both primary spending and revenues would rise substantially and federal debt held by the public would grow nearly 30 percent by 2035, reaching 79 percent of gross domestic product (GDP). The second, the "alternative fiscal scenario," shows an explosion of debt in the medium and longer term: a debt level of 100 percent of GDP in 2023, and 200 percent of GDP by 2037. The contrast between the two sets of projections illustrates how sensitive the fiscal outlook is to potential—but likely—changes to existing tax and health program laws.
The CBO projections, which reflect many assumptions about the future of the economy and federal policy making, must be viewed as providing information, not making predictions. Recognizing the great uncertainty that stems from the yet to be implemented health care reform legislation, the report itself focuses primarily on the next 25 years.
A Tale of Two Scenarios
The Extended Baseline Scenario
The extended-baseline scenario (also known as "current law" projections) assumes that current tax and spending laws will remain unchanged. For example, under this scenario, CBO assumes the following policies will be implemented as scheduled, and extends their effects in the future:
- the 2001 and 2003 tax cuts will expire at the end of this year as scheduled;
- the provisions that keep growing numbers of taxpayers from paying the alternative minimum tax (AMT) expire at the end of this year as scheduled;
- Medicare physician payment rate will be adjusted as required by current law, resulting in cuts to physician payments of approximately 20 percent;
- reductions to federal health spending projected from provisions in the new health care reform act such as cuts in payments to Medicare Advantage plans, lower payments increases to hospitals and other providers due to improvements in productivity, cost reductions in Medicare proposed by the new Independent Payment Advisory Board (IPAB), and restrictions on growth in premium subsidies; and
- implementation of the new excise tax on high-premium health insurance plans in the health reform law.
The expiration of the 2001 and 2003 tax cuts and inflation-adjustments for the AMT, together with the anticipated economic recovery, would cause revenues to increase dramatically from about 15 percent of GDP this year to nearly 18 percent next year. Thereafter, under the extended baseline, revenues would continue to rise far beyond 18 percent of GDP, their historical average of the last 50 years, due to growth in real income, growing number of individuals paying the AMT, and income resulting from excise taxes on high premium health insurance. Under this scenario, revenues would reach 23 percent of GDP in 2035, 26 percent of GDP in 2050, and 30 percent of GDP in 2080.
Primary spending under the extended baseline scenarios (all spending excluding interest payments on the federal debt) is projected to drop to 20 percent due to the phasing out of the stimulus; and gradually creep up to 24 percent within 15 years, largely due to the rising cost of health care 1. Assuming that the provisions in the new health care reform law to curb rising healthcare costs are implemented and maintained as designed, CBO projects that federal spending for health care entitlements (Medicare, Medicaid, new health insurance subsidies, and health benefits for federal employees and Veterans would grow by 76 percent as a percentage of GDP over the next 25 years. (Health care costs would grow even faster--by 98 percent--if the cost containment provisions are not implemented and maintained, as CBO illustrates in the alternative fiscal scenario.)
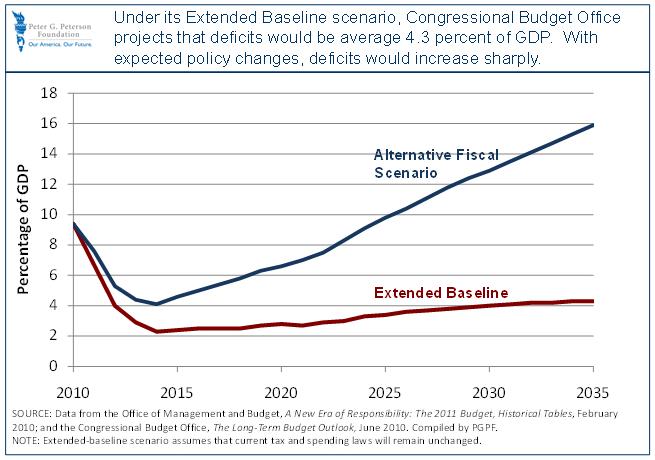
As a result, CBO projects an optimistic budget picture for the extended-baseline scenario. Primary spending would equal revenues by 2015 and continue to be in balance through 2035; with deficits averaging 4.3 percent of GDP (see Figure 1). Debt-to-GDP levels would rise gradually from today's 62 percent of GDP to 79 percent of GDP in 2035 to 107 percent in 2080.
Figure 1. Projected Deficits Under Two Scenarios of the Long-Term Budget Outlook
The Alternative Fiscal Scenario
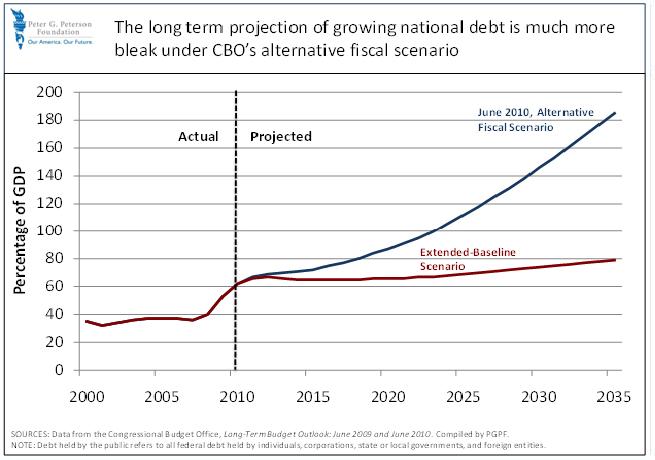
The alternative fiscal scenario— which CBO offers to present a more realistic budget picture that includes many anticipated legislative changes by lawmakers—shows a much worse budget outlook than the extended-baseline scenario (see Figure 2).
Figure 2: Projected Debt Held by the Public Under Two Scenarios of the Long-Term Budget Outlook
The alternative scenario includes expected changes to current laws and excludes enacted policies widely considered unsustainable over the long term including:
- extension of 2001 and 2003 tax cuts (except for the top two income tax brackets);
- tax changes after 2020 that would prevent revenues from increasing as a percentage of GDP real incomes rise;
- changing the way that Medicare physician payments would be adjusted each year by using the Medicare Economic Index instead of the lower rate required under current law by the Medicare Sustainable Growth Rate formula; and
- discontinuation after 2020 of certain provisions in the health care reform legislation that are designed to restrain health care growth (reductions in Medicare payments to hospitals and other providers due to improvements in productivity, IPAB-recommended changes to Medicare to reduce costs, and statutory restrictions on the growth in premium subsidies).
The assumed policy modifications in this alternative scenario would lead to lower projected revenues than the extended-baseline. CBO estimates that revenues would hover around 15 percent of GDP in the near term. In the long run, CBO assumes future adjustments to tax policy would keep revenues constant at 19.3 percent of GDP.
Health spending under the alternative fiscal scenario would rise 0.4 percent a year faster, on average, than under the extended baseline. As a result, by 2035, total non-interest spending under the alternative scenario would be 11 percent larger than CBO projects under the extended baseline.
Health care entitlements programs and Social Security will be the largest contributors to growing spending levels over the longer term. CBO projects that Social Security spending will increase by 1.4 percent of GDP between now and 2035, then stabilize at around 6 percent of GDP. Social Security’s benefits, which CBO estimates will exceed payroll tax income in 2010, will annually exceed that primary source of financing beginning in 2016. As a result, by 2037, CBO estimates that the program will be unable to pay all benefits scheduled under current law under either scenario. (For more about Social Security’s current financial condition and options to address it, see Box 1.)
By 2035, under the alternative fiscal scenario, CBO projects federal spending would account for more than one-third of the total U.S. economy. As a result of resistance to higher taxation and rising health spending assumed under the alternative projections, CBO estimates that federal debt held by the public would reach 185 percent of GDP within 25 years—triple its 2010 level—and that spending for net interest will be six times higher than it cost this year. 2
Box 1:
Fixing Social Security
Congressional Budget Office, Social Security Policy Options Report, June 1, 2010
With a growing number of Americans living longer, Social Security the largest entitlement program faces insolvency within the next two decades. CBO's report, Social Security Policy Options, provides an updated view of Social Security's deteriorating finances and analyzes various approaches to improve the program's long run sustainability. CBO estimates the Social Security program will run a cash deficit this year—in other words; benefits payments will exceed the income from taxes. While the program's cash picture should improve as the economy and employment levels recovers, and Social Security will again generate cash surpluses, CBO projects that by 2016 that the program's cash deficits will be permanent. Within another 25 years the resources dedicated to Social Security will not fully cover the benefits promised under current law. If payroll taxes do not increase, benefits would have to be cut by 20 percent in 2040. Measured another way, Social Security faces an actuarial deficit of 0.6 percent of GDP over the next 75 years. That shortfall represents how much revenues would have to be raised, benefits lowered, or some combination of the two, to keep Social Security's finances solvency over the next 75 years. The options that would create the most improvement in Social Security's finances would involve: changing the way in which initial benefits are calculated; raising the amount of earnings subject to payroll taxes; and increasing the payroll tax rates. Other frequently proposed options such as raising the full retirement age and reducing the cost-of-living adjustments for ongoing benefits would have smaller impacts on reducing the 75-year actuarial balance. 3
The Fiscal Gap and Its Economic Consequences
In the alternative fiscal scenario, CBO projects the 75-year fiscal gap (or the measurement of the long-term imbalance between spending and revenue in present-value terms) to be 8.7 percent of GDP. This is substantially larger than the 0.7 percent of GDP fiscal gap under CBO's extended-baseline scenario (which assumes current legislation will remain unchanged).
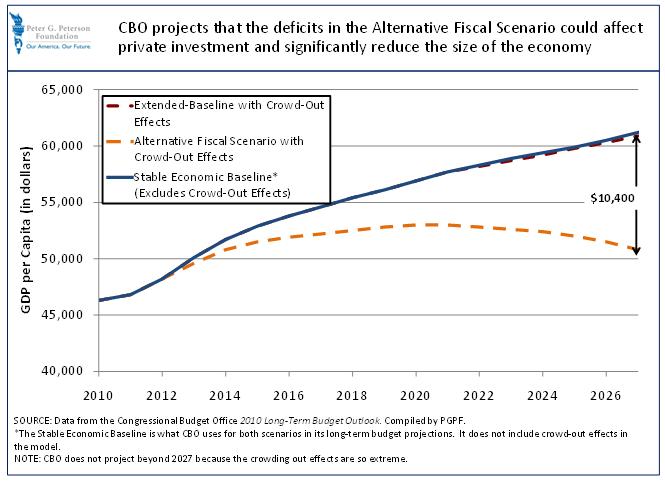
High deficits and rising debt carry a heavy economic cost and could potentially lead to financial burdens and lower living standards (as measured by real GDP per capita) for all of us. CBO projects that under the alternative scenario GDP per capita could stop growing in 2022. That impact on the U.S. standard of living would result from growing debt to GDP levels "crowd out" private investment in productive capital and lead to other economic consequences that would dampen growth. GDP per capita would be $3,900 lower in 2020, CBO estimates, and over $10,000 by 2027 (see Figure 3).4 On the other hand, the crowding out resulting from the extended baseline scenario would be minimal according to CBO’s projections.
Furthermore, growing deficits and debt could increase the risk that foreign lenders will lose confidence in America's ability to pay back its debt. As a result they could demand higher interest rates, forcing policy makers to choose between sudden increases in taxes, sharp reductions in spending, or a vicious spiral of even larger deficits, interest costs, and debt.
Figure 3. "Crowding Out" Effects from High Deficits
What Needs to be Done?
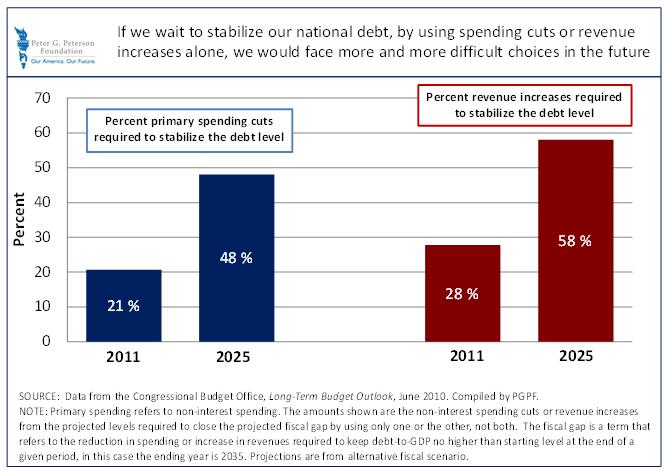
The CBO report show that under even the most optimistic assumptions used by the extended baseline scenario, fiscal policy is on an unsustainable course. Under the more politically realistic alternative fiscal scenario, the outlook for the federal budget is significantly more challenging. At a minimum, the projections imply that policy makers should not make the budget outlook worse by adopting popular policies that would increase projected deficits and debt. In addition, the report provides compelling evidence that delay in taking the necessary steps toward a sustainable fiscal future makes the choices more difficult (see Figure 4).
Everything must be on the table in addressing these long term imbalances. Reforms to both spending and revenues will be necessary, as well as budget controls (such as spending caps and stricter PAYGO rules).
Figure 4. Waiting to Close the Fiscal Gap Will Require Tougher Choices
1 Since the previous long-term budget outlook in June 2009, CBO has made the largest revisions to its revenue projections. Those changes primarily stem from new excise taxes on certain high premium health care insurance. Mostly reflecting revisions to projected health care costs, primary spending is slightly higher in the near term but lower after 2030.
2Since June 2009, when CBO last released long-term projections under the alternative fiscal scenario, there have been relatively minor changes. Most changes are on the revenue side and reflect faster growth on receipts from income tax over the next 10 years, and the new assumption that the 2001 and 2003 tax cuts will not be extended for the top two tax brackets. CBO also held revenues constant after 2020 to reflect revisions to tax policy in the future.
3Options such as “raising the full retirement age” would be phased in over a period, and therefore would have smaller effects on the actuarial balance than options that take effect in a single year.
4CBO does not project beyond 2027 because the crowding out effects are so extreme