
You are here
11 Charts That Show How Our National Debt Grew in 2019
Federal debt held by the public continues to grow, and this year it reached its highest level relative to the size of the economy since 1948. Over the next 10 years, our debt will continue to mount as growth in spending — fueled primarily by the aging population, rising healthcare costs, and escalating interest payments — will significantly outpace the projected growth in revenues.
Here are eleven charts that tell America’s fiscal story for 2019 — and show how our outlook went from bad to worse over the last 12 months.
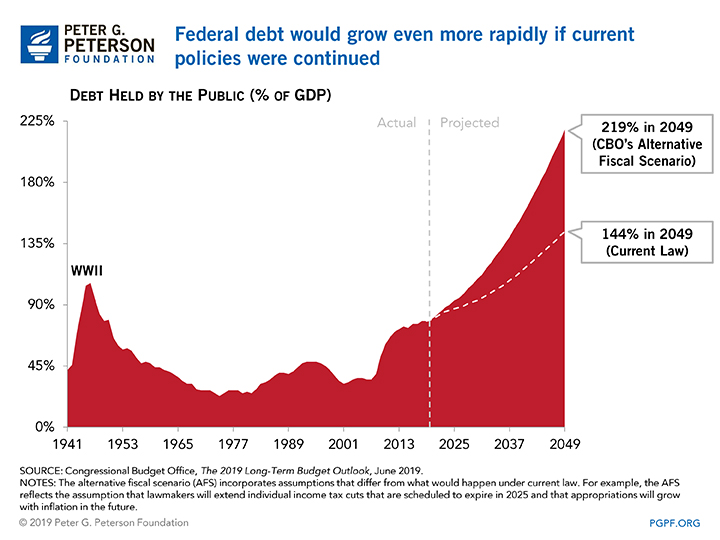
1. The federal debt is on an unsustainable path. 
If lawmakers make no changes to current law, debt held by the public is projected to climb to 144 percent of gross domestic product (GDP) by 2049. However, under an alternative fiscal scenario, the outlook could be even worse. If lawmakers choose to continue certain policies — for example, extending the tax cuts enacted in December 2017 — the debt would swell to over twice the size of the economy by 2049.
2. Revenue growth is not keeping pace with the growth in spending.
This growing mismatch drives rising federal deficits and it partly reflects the fiscal effects of policies enacted in recent years.

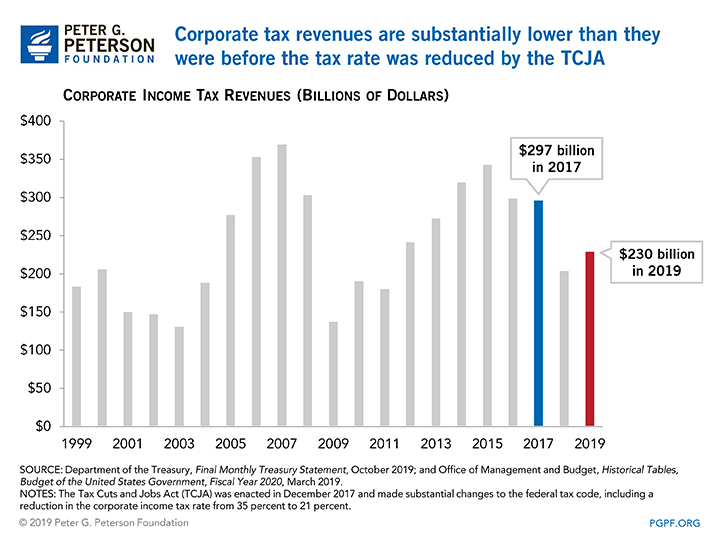
3. Corporate tax revenue has not recovered since the enactment of the Tax Cuts and Jobs Act.
Although economists do not agree on the eventual economic effects of the TCJA, it is clear that corporate tax payments are significantly lower than they would have been in the absence of the law.
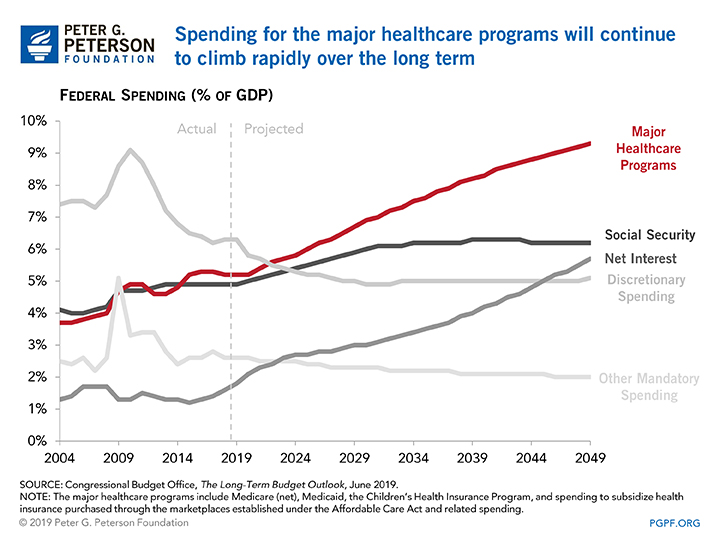
4. Healthcare is a major driver of the projected growth in spending over the long term.
There are many possible factors for why Americans are paying more for healthcare, ranging from the consolidation of hospitals to administrative waste. In fact, overall healthcare spending in the U.S. is projected to grow faster than the economy, reaching nearly 20 percent of GDP within the decade.
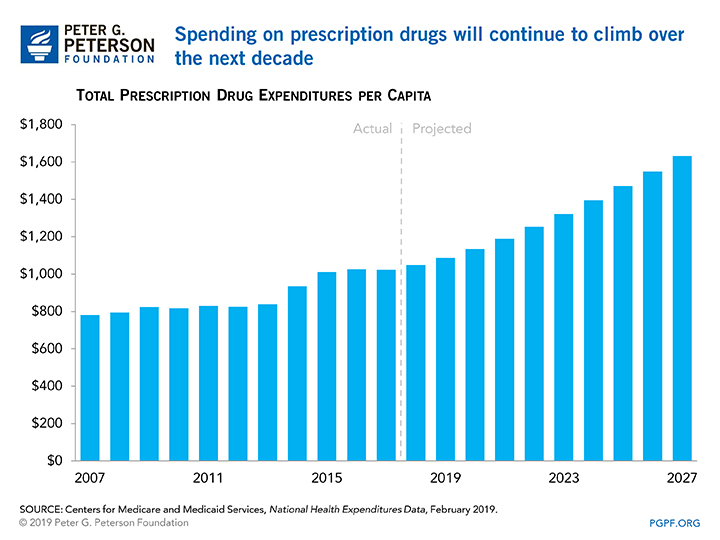
5. The price of prescription drugs is one of the largest drivers of healthcare spending growth.
The Centers for Medicare and Medicaid Services project that such spending will continue to climb to $1,635 per capita by 2027, an increase of 60 percent from 2017.
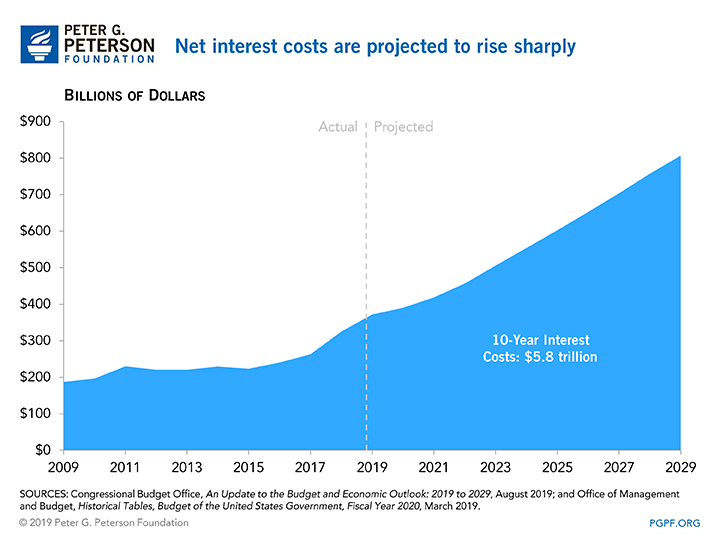
6. Interest is the fastest-growing “program” in the federal budget.
Net interest payments totaled $376 billion in 2019 and grew by 16 percent in 2019. By 2029, these payments are projected to be more than twice the size they were last year.
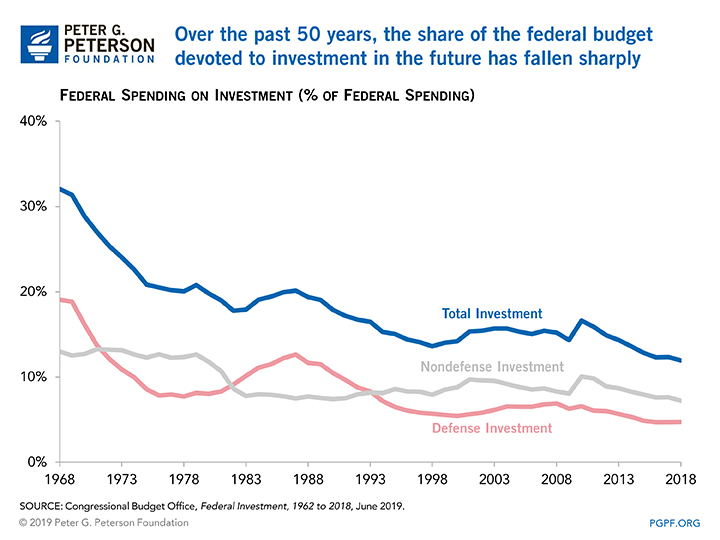
7. Public investment in our future is declining as a percent of federal spending.
Public investment now represents only 12 percent of total federal spending. Declining investment could dampen the future expansion of the economy and place the nation at a competitive disadvantage.
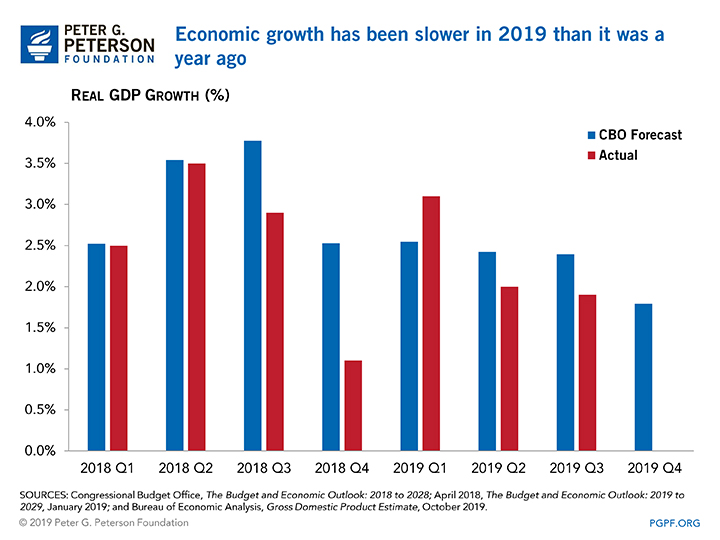
8. The growth of real (inflation-adjusted) GDP in 2019 is on track to be lower than it was in 2018.
Economic growth is generally determined by changes to productivity and in the size of the labor force. Recent fiscal policies have boosted GDP, but growth is projected to slow as the effects of that stimulus wane and the U.S. population undergoes an unprecedented demographic shift.
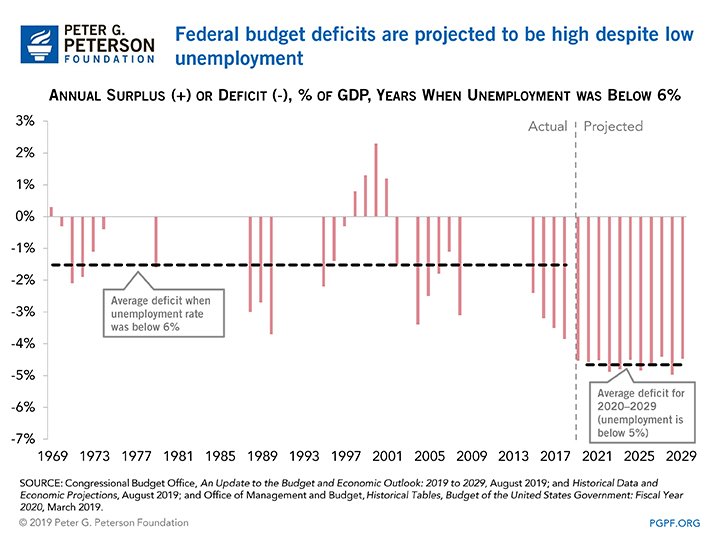
9. Federal deficits are growing in a period of low unemployment and economic growth — and that’s unusual.
Despite the dangers of procyclical fiscal policies during an economic expansion, deficits are expected to remain large in the future, leaving us with less room to maneuver if there is an economic downturn. Over the following 10 years the average deficit is projected to be 4.7 percent of GDP if current laws remain the same. That’s more than three times the average deficit in past periods of low unemployment.
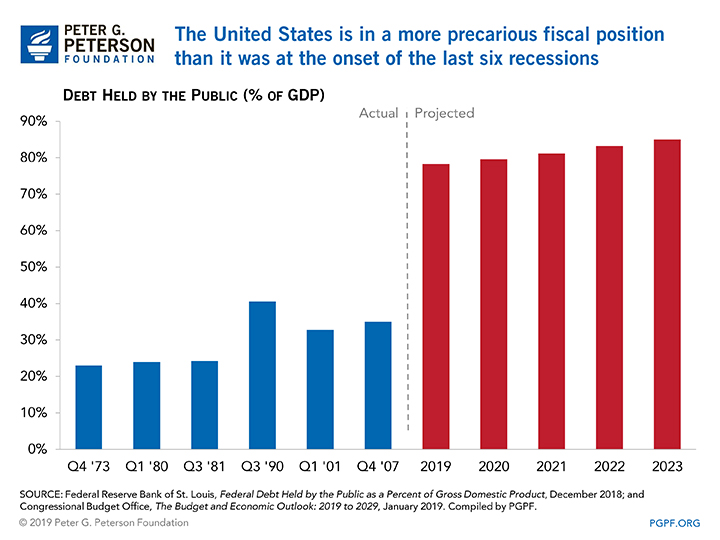
10. We don’t know when the next economic downturn might come, but it’s clear that the United States is already in a more precarious position than it was at the onset of the last six recessions.
Debt held by the public as a percentage of GDP at the beginning of the last six recessions averaged 30 percent. In contrast, at the end of 2018, debt held by the public reached 78 percent of GDP, more than twice the average at the beginning of the last six recessions and the highest level since 1950.
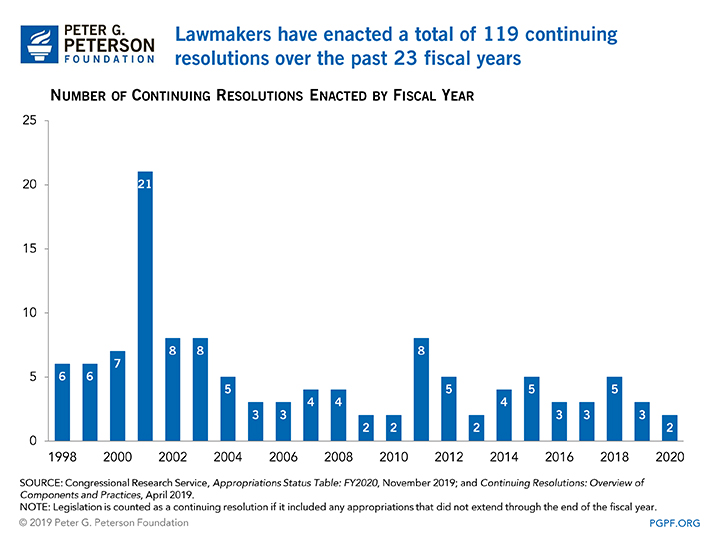
11. Lawmakers need to think long-term to address our fiscal challenges, but they continue to have difficulty enacting annual appropriations in a timely manner.
For fiscal year 2020, the government is once again operating under a temporary funding measure known as a continuing resolution.
Related: Economic Growth Rates in 2019 Are On Track To Be Lower Than In 2018