
You are here
Peter G. Peterson Foundation March "Fiscal Confidence Index" Finds High Levels of Concern about America's Long-Term Debt and Little Optimism about Washington's Ability to Resolve Fiscal Challenges
Contact: Sarah Stipicevic, Press Secretary
(212) 542-9265 sstipicevic@pgpf.org
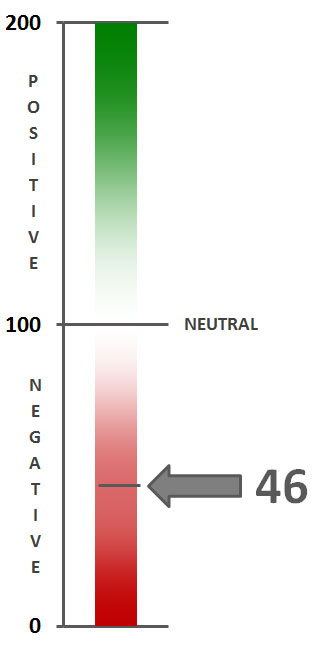
The March 2013 Fiscal Confidence Index, Modeled after the Consumer Confidence Index, is 46 (100 is Neutral), Indicating Strongly Negative Public Sentiment
Only 39% of Americans Think President Obama and Congress are Likely to Reach Agreement on Long-Term Debt, Fewer than on Gun Control (40%) and Immigration (52%)
61% of Respondents Believe Recent Meetings Between President Obama and Congressional Republicans are "Typical Political Posturing"; Only 31% See Bipartisan Meetings as a "Significant Step Toward Compromise" on Long-Term Debt Reduction
NEW YORK — Americans continue to show high levels of concern about the nation’s long-term debt and believe the country is on the wrong track when it comes to addressing debt, according to the Peter G. Peterson Foundation’s latest Fiscal Confidence Index, a monthly measure of public attitudes about the nation’s long-term debt and the efforts elected leaders are making to address the debt.
The March 2013 Fiscal Confidence Index, modeled after the Consumer Confidence Index, is 46 (100 is neutral), indicating strongly negative public sentiment about America’s fiscal situation. Sentiment is slightly less negative than February’s reading of 43 and January’s reading of 40, yet remains more negative than December’s reading of 52.
The Fiscal Confidence Index measures public opinion about the national debt by asking six questions in three key areas:
- CONCERN: Level of concern and views about the direction of the national debt.
- PRIORITY: How high a priority addressing the debt should be for elected leaders.
- EXPECTATIONS: Expectations about whether the debt situation will get better or worse in the next few years.
The survey results from these three areas are weighted equally and averaged to produce the Fiscal Confidence Index value. The Fiscal Confidence Index, like the Consumer Confidence Index, is indexed on a scale of 0 to 200, with a neutral midpoint of 100. A reading above 100 indicates positive sentiment. A reading below 100 indicates negative sentiment.
"The March Fiscal Confidence Index shows that Americans want Congress and the President to take action on our long-term debt," said Michael A. Peterson, President and COO of the Peterson Foundation. "Now that our elected leaders have moved beyond the fiscal brinksmanship, and each house of Congress has passed a budget blueprint, President Obama and Congressional leaders should use this opportunity to help restore Americans' confidence by finally solving our long-term debt problem."
Fiscal Confidence Index Key Data Points:
- The March 2013 Fiscal Confidence Index value is 46. A score of 100 is neutral. Values below 100 show negative sentiment, while values above 100 show positive sentiment. (February’s value was 43. January's value was 40.)
- The current Fiscal Confidence Index score for CONCERN about the debt is 40, indicating strong concern about the debt. The score for debt as a PRIORITY that leaders must address is 21, indicating that Americans want elected leaders to make addressing long-term debt a high priority. The score for EXPECTATIONS about progress on the debt over the next few years is 77, indicating pessimism about the direction of long-term fiscal policy in the next few years. The Fiscal Confidence Index of 46 is the average of these three sub-category scores.
- The Fiscal Confidence Index and sub-category scores have shown a slight upward trend from January through March, possibly reflecting a moderation in the intensity of the debt debate since the early 2013 fiscal cliff agreement, however, sentiment is still well below positive levels.
- For a description of the complete methodology, see the Appendix below.
Americans See Greater Likelihood of Bipartisan Agreement on Immigration and Gun Control than on Long-Term Debt
As President Obama and Congress look to move beyond deadline-driven fiscal policy and focus on the broader policy agenda, the Peterson Foundation asked Americans whether a bipartisan agreement can be reached on key issues.
- Only 39% believe a long-term debt agreement is likely, versus 57% who believe it is unlikely. Views on long-term debt were the most pessimistic among the three issues.
- 40% of Americans believe an agreement on gun control is likely, while 54% believe it is unlikely.
- Americans are most optimistic about an agreement on immigration, with 52% saying an agreement is likely and 43% saying an agreement is unlikely.
- Asked whether recent meetings between President Obama and Congressional Republicans represent a "significant step toward compromise" on long-term debt reduction or "typical political posturing," 61% of Americans see typical posturing versus 31% who see the meetings as a significant step.
The Peter G. Peterson Foundation commissioned the poll by the Global Strategy Group to survey public opinion on the national debt. The nationwide poll included 1,003 U.S. registered voters, surveyed by telephone between March 18 and March 21, 2013. The poll has a margin of error of +/- 3.1%. The poll examined voters’ opinions on the national debt, political leadership, and America’s fiscal and economic health.
Detailed poll results can be found online at: www.pgpf.org/what-we-are-doing/education-and-awareness/fiscal-confidence-index
About the Peter G. Peterson Foundation
The Peter G. Peterson Foundation is a nonprofit, nonpartisan organization established by Pete Peterson — businessman, philanthropist, and former U.S. Secretary of Commerce. The Foundation is dedicated to increasing public awareness of the nature and urgency of key long-term fiscal challenges threatening America's future and to accelerating action on them. To address these challenges successfully, we work to bring Americans together to find and implement sensible, long-term solutions that transcend age, party lines and ideological divides in order to achieve real results. To learn more, please visit www.pgpf.org.
APPENDIX: Fiscal Confidence Index Methodology and Questions
- The Fiscal Confidence Index is released monthly by the Peter G. Peterson Foundation.
- The Fiscal Confidence Index value is based on six questions in three categories.
- As is done with the Consumer Confidence Index, the first step in calculating the Fiscal Confidence Index is determining the "Relative Value" for each question. This calculation is made by taking the positive response for each question and dividing it by the sum of the positive and negative responses. Each question was asked on a four-point scale, and answers were weighted according to intensity, with the strongest responses counting twice as much as the middle responses ("much" better or worse answers count twice as heavily as "somewhat" better or worse answers).
- The scores for the Concern, Priority, and Expectations categories are determined by averaging the scores derived from the two questions in each category.
- The Fiscal Confidence Index value is converted from the Relative Value to place it on a scale on which 100 indicates equal positive and negative sentiment, while values below 100 indicate negative sentiment and values above 100 indicate positive sentiment.
- The Peter G. Peterson Foundation commissioned a poll by the Global Strategy Group to survey public opinion on the national debt. The nationwide poll included 1,003 U.S. registered voters, surveyed by telephone between March 18 and March 21, 2013. The poll has a margin of error of +/- 3.1%. The poll examined voters' opinions on the national debt, political leadership, and America’s fiscal and economic health.
- The questions are as follows:
| CONCERN (40) | ||||
|---|---|---|---|---|
|
Thinking about our national debt over the last few years, would you say your level of concern has increased or decreased? ◊ Is that a lot or just a little? |
Mar. 2013 | Feb. 2013 | Jan. 2013 | |
| Increased a lot | 58% | 52% | 60% | |
| Increased a little | 18% | 24% | 21% | |
| Decreased a little | 7% | 7% | 4% | |
| Decreased a lot | 5% | 3% | 2% | |
| (No change) | 11% | 13% | 12% | |
| (Don't Know/Refused) | 1% | 1% | 1% | |
| INCREASED (NET) | 76% | 76% | 81% | |
| DECREASED (NET) | 11% | 10% | 7% | |
|
When it comes to addressing our national debt, would you say things in the United States are heading in the right direction or do you think things are off on the wrong track? ◊ Do you feel that way strongly or just somewhat? |
Mar. 2013 | Feb. 2013 | Jan. 2013 | |
| Right direction-Strongly | 13% | 11% | 9% | |
| Right direction-Somewhat | 19% | 20% | 19% | |
| Wrong track-Somewhat | 14% | 17% | 17% | |
| Wrong track-Strongly | 45% | 42% | 44% | |
| (Neither/Mixed) | 4% | 6% | 7% | |
| (Don't Know/Refused) | 4% | 5% | 5% | |
| RIGHT DIRECTION (NET) | 32% | 30% | 28% | |
| WRONG TRACK (NET) | 60% | 59% | 60% | |
| PRIORITY (21) | ||||
|---|---|---|---|---|
|
Some people say that addressing the national debt should be among the President and Congress' top 3 priorities. Do you agree or disagree? ◊ Do you feel that way strongly or just somewhat? |
Mar. 2013 | Feb. 2013 | Jan. 2013 | |
| Strongly agree | 68% | 66% | 71% | |
| Somewhat agree | 15% | 21% | 18% | |
| Somewhat disagree | 7% | 5% | 4% | |
| Strongly disagree | 7% | 4% | 3% | |
| (Don't Know/Refused) | 4% | 4% | 3% | |
| AGREE (NET) | 83% | 87% | 89% | |
| DISAGREE (NET) | 13% | 9% | 7% | |
|
And when it comes to our national debt, do you think it is an issue that the President and Congress should spend more time addressing or less time addressing? ◊ Would you say a lot (more or less) time or just a little? |
Mar. 2013 | Feb. 2013 | Jan. 2013 | |
| A lot more time | 67% | 62% | 68% | |
| A little more time | 15% | 22% | 19% | |
| A little less time | 5% | 6% | 4% | |
| A lot less time | 5% | 3% | 3% | |
| (The same amount of time) | 4% | 4% | 3% | |
| (Don't Know/Refused) | 3% | 3% | 3% | |
| MORE TIME (NET) | 82% | 84% | 87% | |
| LESS TIME (NET) | 10% | 8% | 7% | |
| EXPECTATIONS (77) | ||||
|---|---|---|---|---|
|
And thinking about our national debt over the next few years, do you expect the problem to get better or worse? ◊ Is that much (better or worse) or just somewhat (better or worse)? |
Mar. 2013 | Feb. 2013 | Jan. 2013 | |
| Much better | 10% | 11% | 9% | |
| Somewhat better | 21% | 20% | 21% | |
| Somewhat worse | 22% | 25% | 21% | |
| Much worse | 38% | 37% | 40% | |
| (No change) | 3% | 2% | 4% | |
| (Don't know/Refused) | 6% | 5% | 5% | |
| BETTER (NET) | 31% | 31% | 31% | |
| WORSE (NET) | 60% | 62% | 61% | |
|
And when it comes to our national debt, are you optimistic or pessimistic that the United States will be able to make progress on our national debt over the next few years? ◊ Would you say you are very (optimistic or pessimistic) or just somewhat? |
Mar. 2013 | Feb. 2013 | Jan. 2013 | |
| Very optimistic | 22% | 18% | 19% | |
| Somewhat optimistic | 26% | 32% | 29% | |
| Somewhat pessimistic | 18% | 16% | 18% | |
| Very pessimistic | 30% | 30% | 30% | |
| (Neither/Mixed) | 3% | 2% | 3% | |
| (Don't Know/Refused) | 2% | 3% | 2% | |
| OPTIMISTIC (NET) | 47% | 49% | 48% | |
| PESSIMISTIC (NET) | 48% | 46% | 47% | |