
You are here
Peter G. Peterson Foundation April "Fiscal Confidence Index" Finds American Public Remains Highly Concerned about America's Long-Term Debt
Contact: Sarah Stipicevic, Press Secretary
(212) 542-9265 sstipicevic@pgpf.org
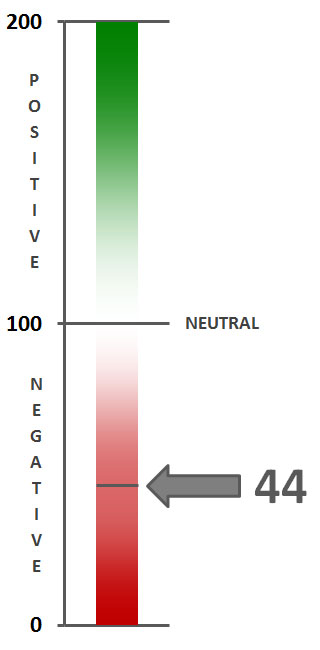
The April 2013 Fiscal Confidence Index, Modeled after the Consumer Confidence Index, is 44 (100 is Neutral), Indicating Strongly Negative Public Sentiment
Fewer than half of Americans (42%) believe Social Security will have enough money to provide benefits for their retirement and 86% believe that without reforms Social Security and Medicare will put too much of a financial burden on younger Americans
A majority of voters finds President Obama’s budget proposal to be a "very" or "somewhat" significant step toward compromise, though attitudes are sharply split along partisan lines
NEW YORK — Americans continue to show high levels of concern about our nation’s long-term debt, according to the Peter G. Peterson Foundation's latest Fiscal Confidence Index, a monthly measure of public attitudes about the nation’s long-term debt and the efforts elected leaders are making to address the debt.
The April 2013 Fiscal Confidence Index, modeled after the Consumer Confidence Index, is 44 (100 is neutral), indicating strongly negative public sentiment about America’s fiscal situation. Sentiment has remained consistently very negative throughout 2013, remaining between 40 and 46.
The Fiscal Confidence Index measures public opinion about the national debt by asking six questions in three key areas:
- CONCERN: Level of concern and views about the direction of the national debt.
- PRIORITY: How high a priority addressing the debt should be for elected leaders.
- EXPECTATIONS: Expectations about whether the debt situation will get better or worse in the next few years.
The survey results from these three areas are weighted equally and averaged to produce the Fiscal Confidence Index value. The Fiscal Confidence Index, like the Consumer Confidence Index, is indexed on a scale of 0 to 200, with a neutral midpoint of 100. A reading above 100 indicates positive sentiment. A reading below 100 indicates negative sentiment.
"The April Fiscal Confidence Index shows that Americans remain very concerned about our nation's long-term debt," said Michael A. Peterson, President and COO of the Peterson Foundation. "This survey shows that Americans understand that our unsustainable fiscal path threatens important programs and the next generation. It's time for Congress and the Administration to address these valid and widespread concerns, and finally solve our long-term debt problem."
Fiscal Confidence Index Key Data Points:
- The April 2013 Fiscal Confidence Index value is 44. A score of 100 is neutral. Values below 100 show negative sentiment, while values above 100 show positive sentiment. (March’s value was 46. February’s value was 43.)
- The current Fiscal Confidence Index score for CONCERN about the debt is 38, indicating strong concern about the debt. The score for debt as a PRIORITY that leaders must address is 18, indicating that Americans want elected leaders to make addressing long-term debt a high priority. The score for EXPECTATIONS about progress on the debt over the next few years is 74, indicating pessimism about the direction of long-term fiscal policy in the next few years. The Fiscal Confidence Index of 44 is the average of these three sub-category scores.
- The Fiscal Confidence Index and sub-category scores have remained consistently negative for the first four months of 2013.
- For a description of the complete methodology, see the Appendix below.
Americans — Especially Younger Americans — Are Concerned about the Future of Social Security and Medicare
- With the future of Social Security at the center of public discussion, only 42% of Americans believe Social Security will have the money to provide benefits for their retirement. 47% believe Social Security will not be able to provide benefits.
- Views of Social Security’s ability to fund benefits vary significantly by age. Americans 65 and over are most confident (72%) that Social Security will provide for them. Americans 18-44 are least confident — just 25% believe Social Security will be able to provide for their retirement.
- 86% of Americans are concerned that, without reforms, Social Security and Medicare benefits will put too much of a financial burden on future generations. This high level of concern is consistent across all age ranges.
Americans See the Benefits of Addressing the Nation's Long-Term Debt
The Peterson Foundation asked Americans to rate the importance of several possible benefits of reducing the country's long-term debt burden.
- Voters place particularly high value on having resources to invest in education (75% important, 36% extremely important).
- Americans want to see the country build a strong foundation for future economic growth (77% important, 32% extremely important).
- Improving national security also rates highly (70% important, 32% extremely important).
On May 7, 2013, the Peterson Foundation will host its 2013 Fiscal Summit: Facing the Future, which will focus on the connection between long-term debt and America's future.
Americans are Split Along Partisan Lines about Whether President Obama's Budget is a Significant Step Toward Compromise
In the days following the release of President Obama's Fiscal Year 2014 budget, the Peterson Foundation asked Americans whether they view the President's proposal to increase revenue and reduce spending to help lower deficits as a significant step toward compromise.
- 53% of Americans view the President's budget as a very significant (14%) or somewhat significant (39%) step toward compromise, while 38% believe it is not that significant (16%) or not significant at all (22%).
- Views split sharply along party lines. 82% of Democrats versus 27% of Republicans view the President’s proposal as very significant or somewhat significant. Independents are evenly divided — 45% believe the President’s proposal is very significant or somewhat significant and 45% believe it is not that significant or not significant at all.
The Peter G. Peterson Foundation commissioned the poll by the Global Strategy Group to survey public opinion on the national debt. The nationwide poll included 1,001 U.S. registered voters, surveyed by telephone between April 22 and April 25, 2013. The poll has a margin of error of +/- 3.1%. The poll examined voters' opinions on the national debt, political leadership, and America’s fiscal and economic health.
Detailed poll results can be found online at: www.pgpf.org/fiscalconfidenceindex
About the Peter G. Peterson Foundation
The Peter G. Peterson Foundation is a nonprofit, nonpartisan organization established by Pete Peterson — businessman, philanthropist, and former U.S. Secretary of Commerce. The Foundation is dedicated to increasing public awareness of the nature and urgency of key long-term fiscal challenges threatening America's future and to accelerating action on them. To address these challenges successfully, we work to bring Americans together to find and implement sensible, long-term solutions that transcend age, party lines and ideological divides in order to achieve real results. To learn more, please visit www.pgpf.org.
APPENDIX: Fiscal Confidence Index Methodology and Questions
- The Fiscal Confidence Index is released monthly by the Peter G. Peterson Foundation.
- The Fiscal Confidence Index value is based on six questions in three categories.
- As is done with the Consumer Confidence Index, the first step in calculating the Fiscal Confidence Index is determining the "Relative Value" for each question. This calculation is made by taking the positive response for each question and dividing it by the sum of the positive and negative responses. Each question was asked on a four-point scale, and answers were weighted according to intensity, with the strongest responses counting twice as much as the middle responses ("much" better or worse answers count twice as heavily as "somewhat" better or worse answers).
- The scores for the Concern, Priority, and Expectations categories are determined by averaging the scores derived from the two questions in each category.
- The Fiscal Confidence Index value is converted from the Relative Value to place it on a scale on which 100 indicates equal positive and negative sentiment, while values below 100 indicate negative sentiment and values above 100 indicate positive sentiment.
- The Peter G. Peterson Foundation commissioned a poll by the Global Strategy Group to survey public opinion on the national debt. The nationwide poll included 1,001 U.S. registered voters, surveyed by telephone between April 22 and April 25, 2013. The poll has a margin of error of +/- 3.1%. The poll examined voters’ opinions on the national debt, political leadership, and America’s fiscal and economic health.
- The questions are as follows:
| CONCERN (38) | ||||
|---|---|---|---|---|
|
Thinking about our national debt over the last few years, would you say your level of concern has increased or decreased? ◊ Is that a lot or just a little? |
Apr. 2013 | Mar. 2013 | Feb. 2013 | |
| Increased a lot | 52% | 58% | 52% | |
| Increased a little | 21% | 18% | 24% | |
| Decreased a little | 9% | 7% | 7% | |
| Decreased a lot | 4% | 5% | 3% | |
| (No change) | 13% | 11% | 13% | |
| (Don't Know/Refused) | 1% | 1% | 1% | |
| INCREASED (NET) | 73% | 76% | 76% | |
| DECREASED (NET) | 13% | 11% | 10% | |
|
When it comes to addressing our national debt, would you say things in the United States are heading in the right direction or do you think things are off on the wrong track? ◊ Do you feel that way strongly or just somewhat? |
Apr. 2013 | Mar. 2013 | Feb. 2013 | |
| Right direction-Strongly | 8% | 13% | 11% | |
| Right direction-Somewhat | 21% | 19% | 20% | |
| Wrong track-Somewhat | 18% | 14% | 17% | |
| Wrong track-Strongly | 43% | 45% | 42% | |
| (Neither/Mixed) | 6% | 4% | 6% | |
| (Don't Know/Refused) | 4% | 4% | 5% | |
| RIGHT DIRECTION (NET) | 29% | 32% | 30% | |
| WRONG TRACK (NET) | 61% | 60% | 59% | |
| PRIORITY (18) | ||||
|---|---|---|---|---|
|
Some people say that addressing the national debt should be among the President and Congress' top 3 priorities. Do you agree or disagree? ◊ Do you feel that way strongly or just somewhat? |
Apr. 2013 | Mar. 2013 | Feb. 2013 | |
| Strongly agree | 64% | 68% | 66% | |
| Somewhat agree | 19% | 15% | 21% | |
| Somewhat disagree | 9% | 7% | 5% | |
| Strongly disagree | 5% | 7% | 4% | |
| (Don't Know/Refused) | 3% | 4% | 4% | |
| AGREE (NET) | 83% | 83% | 87% | |
| DISAGREE (NET) | 14% | 13% | 9% | |
|
And when it comes to our national debt, do you think it is an issue that the President and Congress should spend more time addressing or less time addressing? ◊ Would you say a lot (more or less) time or just a little? |
Apr. 2013 | Mar. 2013 | Feb. 2013 | |
| A lot more time | 65% | 67% | 62% | |
| A little more time | 19% | 15% | 22% | |
| A little less time | 5% | 5% | 6% | |
| A lot less time | 3% | 5% | 3% | |
| (The same amount of time) | 4% | 4% | 4% | |
| (Don't Know/Refused) | 4% | 3% | 3% | |
| MORE TIME (NET) | 84% | 82% | 84% | |
| LESS TIME (NET) | 8% | 10% | 8% | |
| EXPECTATIONS (74) | ||||
|---|---|---|---|---|
|
And thinking about our national debt over the next few years, do you expect the problem to get better or worse? ◊ Is that much (better or worse) or just somewhat (better or worse)? |
Apr. 2013 | Mar. 2013 | Feb. 2013 | |
| Much better | 8% | 10% | 11% | |
| Somewhat better | 21% | 21% | 20% | |
| Somewhat worse | 27% | 22% | 25% | |
| Much worse | 37% | 38% | 37% | |
| (No change) | 3% | 3% | 2% | |
| (Don't know/Refused) | 5% | 6% | 5% | |
| BETTER (NET) | 29% | 31% | 31% | |
| WORSE (NET) | 64% | 60% | 62% | |
|
And when it comes to our national debt, are you optimistic or pessimistic that the United States will be able to make progress on our national debt over the next few years? ◊ Would you say you are very (optimistic or pessimistic) or just somewhat? |
Apr. 2013 | Mar. 2013 | Feb. 2013 | |
| Very optimistic | 18% | 22% | 18% | |
| Somewhat optimistic | 31% | 26% | 32% | |
| Somewhat pessimistic | 18% | 18% | 16% | |
| Very pessimistic | 28% | 30% | 30% | |
| (Neither/Mixed) | 2% | 3% | 2% | |
| (Don't Know/Refused) | 2% | 2% | 3% | |
| OPTIMISTIC (NET) | 49% | 47% | 49% | |
| PESSIMISTIC (NET) | 46% | 48% | 46% | |