
You are here
Year-End Peter G. Peterson Foundation "Fiscal Confidence Index" Remains Low; Americans Remain Consistently Concerned about Nation's Fiscal Outlook Throughout 2013
Contact: Sarah Stipicevic, Press Secretary
(212) 542-9265 sstipicevic@pgpf.org
The December 2013 Fiscal Confidence Index, Modeled after the Consumer Confidence Index, is 43 (100 is Neutral); Continuing a Negative Trend Since the Index Launched One Year Ago
Despite Recent Agreement, A Year of Political Brinksmanship Has Taken a Toll on Voters with Nearly Two-Thirds (66%) Believing the United States is on the Wrong Track in Addressing the National Debt
NEW YORK — The Peter G. Peterson Foundation’s final Fiscal Confidence Index for 2013 shows that American voters hold deep concerns about the nation’s long-term fiscal health, continuing a consistent 12-month trend. The December 2013 Fiscal Confidence Index, modeled after the Consumer Confidence Index, is 43 (100 is neutral), in line with strongly negative public sentiment about America’s fiscal situation throughout the past year.
Throughout 2013, the Fiscal Confidence Index remained consistently low:
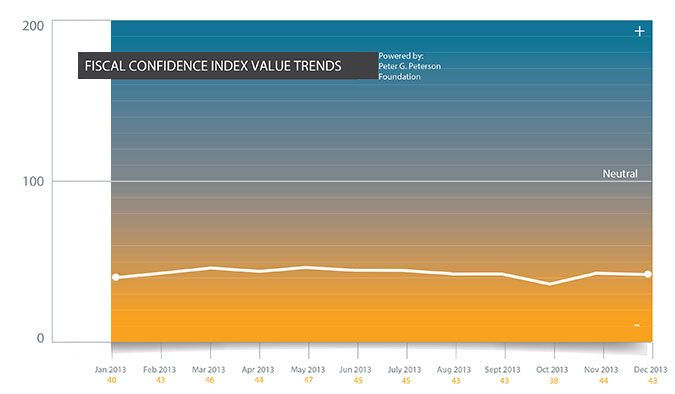
The poll also found that two-thirds of voters now believe the United States is headed on the wrong track, a six-point increase since January 2013, indicating Americans widely reject the short-term approaches favored in Washington throughout the past year.
Michael A. Peterson, President and COO of the Peterson Foundation, said, "After a year of political brinksmanship and a government shutdown, it’s not a surprise that voters remain skeptical about lawmakers’ ability to make progress on the nation’s fiscal issues. Looking to 2014, lawmakers should build on the success of the modest, bipartisan budget agreement, which did not address the drivers of long-term debt but could be a foundation for future collaboration."
The Fiscal Confidence Index measures public opinion about the national debt by asking six questions in three key areas:
- CONCERN: Level of concern and views about the direction of the national debt.
- PRIORITY: How high a priority addressing the debt should be for elected leaders.
- EXPECTATIONS: Expectations about whether the debt situation will get better or worse in the next few years.
The survey results from these three areas are weighted equally and averaged to produce the Fiscal Confidence Index value. The Fiscal Confidence Index, like the Consumer Confidence Index, is indexed on a scale of 0 to 200, with a neutral midpoint of 100. A reading above 100 indicates positive sentiment. A reading below 100 indicates negative sentiment.
Fiscal Confidence Index Key Data Points:
- The December 2013 Fiscal Confidence Index value is 43. A score of 100 is neutral. Values below 100 show negative sentiment, while values above 100 show positive sentiment. (November’s value was 44. October’s value was 38.)
- The current Fiscal Confidence Index score for CONCERN about the debt is 33, indicating deep concern about the debt. The score for debt as a PRIORITY that leaders must address is 24, indicating that Americans want elected leaders to make addressing long-term debt a high priority. The score for EXPECTATIONS about progress on the debt is 73, indicating strong pessimism about the direction of long-term fiscal policy in the next few years. The Fiscal Confidence Index of 43 is the average of these three sub-category scores.
- The December score shows Americans’ attitudes about the national debt were consistently negative throughout 2013.
- For a description of the complete methodology, see the Appendix below.
The Peter G. Peterson Foundation commissioned the poll by the Global Strategy Group to survey public opinion on the national debt. The nationwide poll included 1,003 U.S. registered voters, surveyed by telephone between December 16 and December 19, 2013. The poll has a margin of error of +/- 3.1%. The poll examined voters’ opinions on the national debt, political leadership, and America’s fiscal and economic health.
Detailed poll results can be found online at: www.pgpf.org/what-we-are-doing/education-and-awareness/fiscal-confidence-index
About the Peter G. Peterson Foundation
The Peter G. Peterson Foundation is a nonprofit, nonpartisan organization established by Pete Peterson — businessman, philanthropist, and former U.S. Secretary of Commerce. The Foundation is dedicated to increasing public awareness of the nature and urgency of key long-term fiscal challenges threatening America's future and to accelerating action on them. To address these challenges successfully, we work to bring Americans together to find and implement sensible, long-term solutions that transcend age, party lines and ideological divides in order to achieve real results. To learn more, please visit www.pgpf.org.
APPENDIX: Fiscal Confidence Index Methodology and Questions
- The Fiscal Confidence Index is released monthly by the Peter G. Peterson Foundation.
- The Fiscal Confidence Index value is based on six questions in three categories.
- As is done with the Consumer Confidence Index, the first step in calculating the Fiscal Confidence Index is determining the "Relative Value" for each question. This calculation is made by taking the positive response for each question and dividing it by the sum of the positive and negative responses. Each question was asked on a four-point scale, and answers were weighted according to intensity, with the strongest responses counting twice as much as the middle responses ("much" better or worse answers count twice as heavily as "somewhat" better or worse answers).
- The scores for the Concern, Priority, and Expectations categories are determined by averaging the scores derived from the two questions in each category.
- The Fiscal Confidence Index value is converted from the Relative Value to place it on a scale on which 100 indicates equal positive and negative sentiment, while values below 100 indicate negative sentiment and values above 100 indicate positive sentiment.
- The Peter G. Peterson Foundation commissioned the poll by the Global Strategy Group to survey public opinion on the national debt. The nationwide poll included 1,003 U.S. registered voters, surveyed by telephone between December 16 and December 19, 2013. The poll has a margin of error of +/- 3.1%. The poll examined voters’ opinions on the national debt, political leadership, and America’s fiscal and economic health.
- The questions are as follows:
| CONCERN (33) | ||||
|---|---|---|---|---|
|
Thinking about our national debt over the last few years, would you say your level of concern has increased or decreased? ◊ Is that a lot or just a little? |
Dec 2013 | Nov 2013 | Oct 2013 | |
| Increased a lot | 54% | 54% | 58% | |
| Increased a little | 20% | 20% | 19% | |
| Decreased a little | 8% | 9% | 6% | |
| Decreased a lot | 3% | 4% | 4% | |
| (No change) | 13% | 12% | 11% | |
| (Don't Know/Refused) | 1% | 1% | 2% | |
| INCREASED (NET) | 75% | 74% | 77% | |
| DECREASED (NET) | 11% | 13% | 10% | |
|
When it comes to addressing our national debt, would you say things in the United States are heading in the right direction or do you think things are off on the wrong track? ◊ Do you feel that way strongly or just somewhat? |
Dec 2013 | Nov 2013 | Oct 2013 | |
| Right direction-Strongly | 9% | 9% | 7% | |
| Right direction-Somewhat | 16% | 14% | 12% | |
| Wrong track-Somewhat | 18% | 18% | 18% | |
| Wrong track-Strongly | 48% | 46% | 52% | |
| (Neither/Mixed) | 5% | 7% | 8% | |
| (Don't Know/Refused) | 5% | 5% | 3% | |
| RIGHT DIRECTION (NET) | 25% | 23% | 20% | |
| WRONG TRACK (NET) | 66% | 64% | 70% | |
| PRIORITY (24) | ||||
|---|---|---|---|---|
|
Some people say that addressing the national debt should be among the President and Congress' top 3 priorities. Do you agree or disagree? ◊ Do you feel that way strongly or just somewhat? |
Dec 2013 | Nov 2013 | Oct 2013 | |
| Strongly agree | 62% | 58% | 67% | |
| Somewhat agree | 20% | 21% | 17% | |
| Somewhat disagree | 8% | 8% | 7% | |
| Strongly disagree | 7% | 9% | 6% | |
| (Don't Know/Refused) | 3% | 4% | 3% | |
| AGREE (NET) | 83% | 80% | 83% | |
| DISAGREE (NET) | 15% | 17% | 13% | |
|
And when it comes to our national debt, do you think it is an issue that the President and Congress should spend more time addressing or less time addressing? ◊ Would you say a lot (more or less) time or just a little? |
Dec 2013 | Nov 2013 | Oct 2013 | |
| A lot more time | 58% | 63% | 67% | |
| A little more time | 21% | 21% | 15% | |
| A little less time | 7% | 6% | 6% | |
| A lot less time | 5% | 4% | 4% | |
| (The same amount of time) | 5% | 3% | 4% | |
| (Don't Know/Refused) | 3% | 4% | 3% | |
| MORE TIME (NET) | 80% | 84% | 83% | |
| LESS TIME (NET) | 12% | 9% | 10% | |
| EXPECTATIONS (73) | ||||
|---|---|---|---|---|
|
And thinking about our national debt over the next few years, do you expect the problem to get better or worse? ◊ Is that much (better or worse) or just somewhat (better or worse)? |
Dec 2013 | Nov 2013 | Oct 2013 | |
| Much better | 9% | 9% | 8% | |
| Somewhat better | 22% | 19% | 17% | |
| Somewhat worse | 22% | 24% | 22% | |
| Much worse | 39% | 38% | 43% | |
| (No change) | 4% | 4% | 4% | |
| (Don't know/Refused) | 5% | 6% | 5% | |
| BETTER (NET) | 31% | 28% | 25% | |
| WORSE (NET) | 61% | 62% | 65% | |
|
And when it comes to our national debt, are you optimistic or pessimistic that the United States will be able to make progress on our national debt over the next few years? ◊ Would you say you are very (optimistic or pessimistic) or just somewhat? |
Dec 2013 | Nov 2013 | Oct 2013 | |
| Very optimistic | 18% | 16% | 16% | |
| Somewhat optimistic | 27% | 33% | 27% | |
| Somewhat pessimistic | 17% | 16% | 19% | |
| Very pessimistic | 32% | 28% | 32% | |
| (Neither/Mixed) | 3% | 3% | 4% | |
| (Don't Know/Refused) | 3% | 4% | 3% | |
| OPTIMISTIC (NET) | 45% | 49% | 43% | |
| PESSIMISTIC (NET) | 48% | 45% | 50% | |