
You are here
Peter G. Peterson Foundation September "Fiscal Confidence Index" Finds Voters Remain Deeply Pessimistic About Nation's Fiscal Health
Contact: Sarah Stipicevic, Press Secretary
(212) 542-9265 sstipicevic@pgpf.org
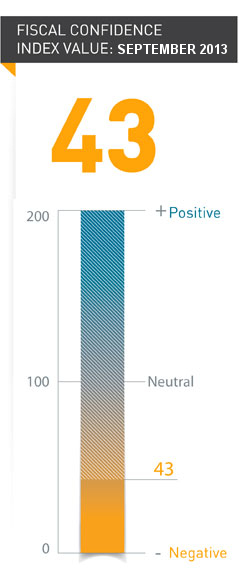
The September 2013 Fiscal Confidence Index, Modeled after the Consumer Confidence Index, is 43 (100 is Neutral); Tenth Straight Month of Strongly Negative Public Sentiment
Threats of a Government Shutdown and Debt Ceiling Standoff Drive Low Public Confidence in Ability of Policymakers to Find Fiscal Solutions
65% of Voters Say the United States is on the Wrong Track When It Comes to Addressing the National Debt
NEW YORK — As fiscal discussions continue with deadlines imminent, The Peter G. Peterson Foundation’s September Fiscal Confidence Index registered continued negative public sentiment on the country’s fiscal challenges. For the tenth consecutive month, voters remain deeply pessimistic about the ability of Congress and the President to find solutions to the nation’s unsustainable long-term debt.
The September 2013 Fiscal Confidence Index, modeled after the Consumer Confidence Index, is 43 (100 is neutral), indicating strongly negative public sentiment about America’s fiscal situation. The overall September Index held even with the August score, and remains lower than a July score of 45. Since the launch of the Fiscal Confidence Index in December 2012, the public attitudes of Americans about the nation’s fiscal position have remained consistently negative.
Michael A. Peterson, President and COO of the Peterson Foundation, said, “As the brinksmanship in Washington continues, Americans remain very concerned about our fiscal outlook, and they demand solutions from our leaders. Rather than governing by crisis, Congress and the President should work immediately toward a comprehensive bipartisan framework to stabilize our debt, which would boost the current recovery and put the nation on a long-term path to prosperity."
The Fiscal Confidence Index measures public opinion about the national debt by asking six questions in three key areas:
- CONCERN: Level of concern and views about the direction of the national debt.
- PRIORITY: How high a priority addressing the debt should be for elected leaders.
- EXPECTATIONS: Expectations about whether the debt situation will get better or worse in the next few years.
The survey results from these three areas are weighted equally and averaged to produce the Fiscal Confidence Index value. The Fiscal Confidence Index, like the Consumer Confidence Index, is indexed on a scale of 0 to 200, with a neutral midpoint of 100. A reading above 100 indicates positive sentiment. A reading below 100 indicates negative sentiment.
Fiscal Confidence Index Key Data Points:
- The September 2013 Fiscal Confidence Index value is 43. A score of 100 is neutral. Values below 100 show negative sentiment, while values above 100 show positive sentiment. (August’s value was 43. July’s value was 45.)
- The current Fiscal Confidence Index score for CONCERN about the debt is 36, indicating strong concern about the debt. The score for debt as a PRIORITY that leaders must address is 22, indicating that Americans want elected leaders to make addressing long-term debt a high priority. The score for EXPECTATIONS about progress on the debt over the next few years is 72, indicating pessimism about the direction of long-term fiscal policy in the next few years. The Fiscal Confidence Index of 43 is the average of these three sub-category scores.
- The September score held steady with the August score. Scores have remained consistently negative since the launch of the Index in December 2012.
- For a description of the complete methodology, see the Appendix below.
The Peter G. Peterson Foundation commissioned the poll by the Global Strategy Group to survey public opinion on the national debt. The nationwide poll included 1,003 U.S. registered voters, surveyed by telephone between September 17 and September 19, 2013. The poll has a margin of error of +/- 3.1%. The poll examined voters’ opinions on the national debt, political leadership, and America’s fiscal and economic health.
Detailed poll results can be found online at: www.pgpf.org/what-we-are-doing/education-and-awareness/fiscal-confidence-index
About the Peter G. Peterson Foundation
The Peter G. Peterson Foundation is a nonprofit, nonpartisan organization established by Pete Peterson — businessman, philanthropist, and former U.S. Secretary of Commerce. The Foundation is dedicated to increasing public awareness of the nature and urgency of key long-term fiscal challenges threatening America's future and to accelerating action on them. To address these challenges successfully, we work to bring Americans together to find and implement sensible, long-term solutions that transcend age, party lines and ideological divides in order to achieve real results. To learn more, please visit www.pgpf.org.
APPENDIX: Fiscal Confidence Index Methodology and Questions
- The Fiscal Confidence Index is released monthly by the Peter G. Peterson Foundation.
- The Fiscal Confidence Index value is based on six questions in three categories.
- As is done with the Consumer Confidence Index, the first step in calculating the Fiscal Confidence Index is determining the "Relative Value" for each question. This calculation is made by taking the positive response for each question and dividing it by the sum of the positive and negative responses. Each question was asked on a four-point scale, and answers were weighted according to intensity, with the strongest responses counting twice as much as the middle responses ("much" better or worse answers count twice as heavily as "somewhat" better or worse answers).
- The scores for the Concern, Priority, and Expectations categories are determined by averaging the scores derived from the two questions in each category.
- The Fiscal Confidence Index value is converted from the Relative Value to place it on a scale on which 100 indicates equal positive and negative sentiment, while values below 100 indicate negative sentiment and values above 100 indicate positive sentiment.
- The Peter G. Peterson Foundation commissioned the poll by the Global Strategy Group to survey public opinion on the national debt. The nationwide poll included 1,003 U.S. registered voters, surveyed by telephone between September 17 and September 19, 2013. The poll has a margin of error of +/- 3.1%. The poll examined voters’ opinions on the national debt, political leadership, and America’s fiscal and economic health.
- The questions are as follows:
| CONCERN (36) | ||||
|---|---|---|---|---|
|
Thinking about our national debt over the last few years, would you say your level of concern has increased or decreased? ◊ Is that a lot or just a little? |
Sept 2013 | Aug 2013 | July 2013 | |
| Increased a lot | 54% | 52% | 55% | |
| Increased a little | 20% | 19% | 20% | |
| Decreased a little | 9% | 10% | 7% | |
| Decreased a lot | 4% | 5% | 6% | |
| (No change) | 12% | 12% | 10% | |
| (Don't Know/Refused) | 1% | 2% | 2% | |
| INCREASED (NET) | 73% | 71% | 75% | |
| DECREASED (NET) | 13% | 15% | 13% | |
|
When it comes to addressing our national debt, would you say things in the United States are heading in the right direction or do you think things are off on the wrong track? ◊ Do you feel that way strongly or just somewhat? |
Sept 2013 | Aug 2013 | July 2013 | |
| Right direction-Strongly | 11% | 9% | 9% | |
| Right direction-Somewhat | 14% | 18% | 19% | |
| Wrong track-Somewhat | 17% | 19% | 16% | |
| Wrong track-Strongly | 48% | 44% | 44% | |
| (Neither/Mixed) | 7% | 6% | 7% | |
| (Don't Know/Refused) | 3% | 5% | 4% | |
| RIGHT DIRECTION (NET) | 25% | 26% | 28% | |
| WRONG TRACK (NET) | 65% | 63% | 60% | |
| PRIORITY (22) | ||||
|---|---|---|---|---|
|
Some people say that addressing the national debt should be among the President and Congress' top 3 priorities. Do you agree or disagree? ◊ Do you feel that way strongly or just somewhat? |
Sept 2013 | Aug 2013 | July 2013 | |
| Strongly agree | 64% | 59% | 60% | |
| Somewhat agree | 20% | 23% | 20% | |
| Somewhat disagree | 7% | 8% | 7% | |
| Strongly disagree | 7% | 5% | 8% | |
| (Don't Know/Refused) | 3% | 5% | 5% | |
| AGREE (NET) | 84% | 82% | 80% | |
| DISAGREE (NET) | 14% | 13% | 14% | |
|
And when it comes to our national debt, do you think it is an issue that the President and Congress should spend more time addressing or less time addressing? ◊ Would you say a lot (more or less) time or just a little? |
Sept 2013 | Aug 2013 | July 2013 | |
| A lot more time | 66% | 64% | 64% | |
| A little more time | 18% | 18% | 20% | |
| A little less time | 6% | 6% | 5% | |
| A lot less time | 5% | 4% | 4% | |
| (The same amount of time) | 3% | 4% | 4% | |
| (Don't Know/Refused) | 2% | 4% | 4% | |
| MORE TIME (NET) | 84% | 83% | 84% | |
| LESS TIME (NET) | 11% | 10% | 9% | |
| EXPECTATIONS (72) | ||||
|---|---|---|---|---|
|
And thinking about our national debt over the next few years, do you expect the problem to get better or worse? ◊ Is that much (better or worse) or just somewhat (better or worse)? |
Sept 2013 | Aug 2013 | July 2013 | |
| Much better | 8% | 8% | 8% | |
| Somewhat better | 16% | 19% | 20% | |
| Somewhat worse | 26% | 28% | 25% | |
| Much worse | 40% | 36% | 37% | |
| (No change) | 3% | 4% | 4% | |
| (Don't know/Refused) | 7% | 6% | 6% | |
| BETTER (NET) | 25% | 27% | 28% | |
| WORSE (NET) | 66% | 63% | 62% | |
|
And when it comes to our national debt, are you optimistic or pessimistic that the United States will be able to make progress on our national debt over the next few years? ◊ Would you say you are very (optimistic or pessimistic) or just somewhat? |
Sept 2013 | Aug 2013 | July 2013 | |
| Very optimistic | 21% | 17% | 20% | |
| Somewhat optimistic | 26% | 30% | 28% | |
| Somewhat pessimistic | 17% | 17% | 18% | |
| Very pessimistic | 28% | 29% | 29% | |
| (Neither/Mixed) | 4% | 4% | 3% | |
| (Don't Know/Refused) | 4% | 3% | 3% | |
| OPTIMISTIC (NET) | 47% | 47% | 47% | |
| PESSIMISTIC (NET) | 45% | 46% | 46% | |