Charts
May 24, 2023
Drivers of spending growth
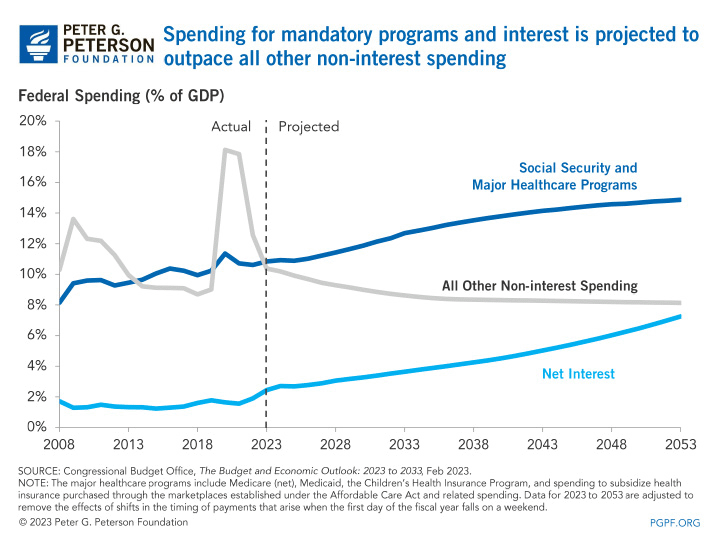
Spending for mandatory programs and net interest is projected to putpace all other non-interest spending.
https://www.pgpf.org/chart-archive/0174_SS_major_health_climb

The search found 146 results in 0.427 seconds.
Spending for mandatory programs and net interest is projected to putpace all other non-interest spending.
https://www.pgpf.org/chart-archive/0174_SS_major_health_climb
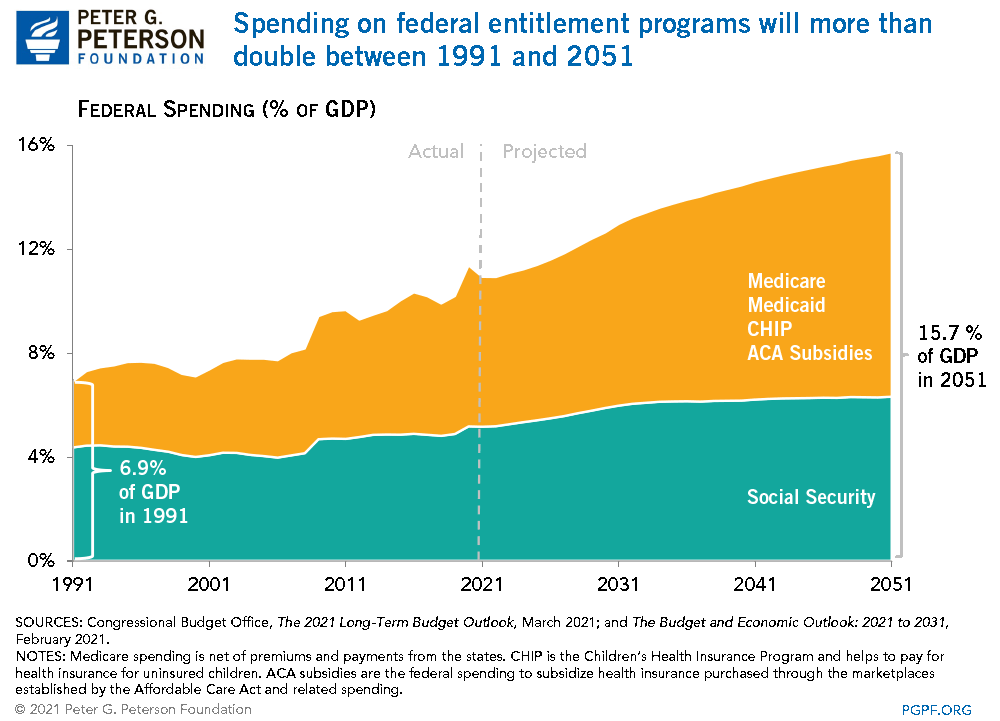
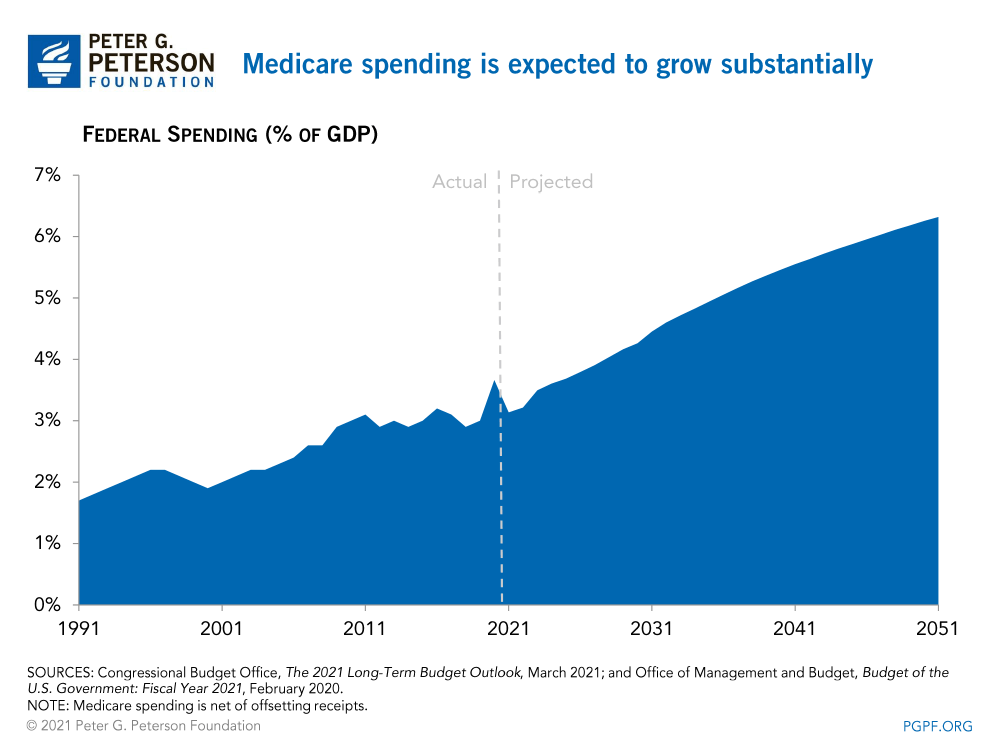
Spending on federal entitlement programs will more than double between 1991 and 2051.
https://www.pgpf.org/chart-archive/0027_entitlement-programs-proj

The PGPF chart pack illustrates that budget-making involves many competing priorities, limited resources, and complex issues.
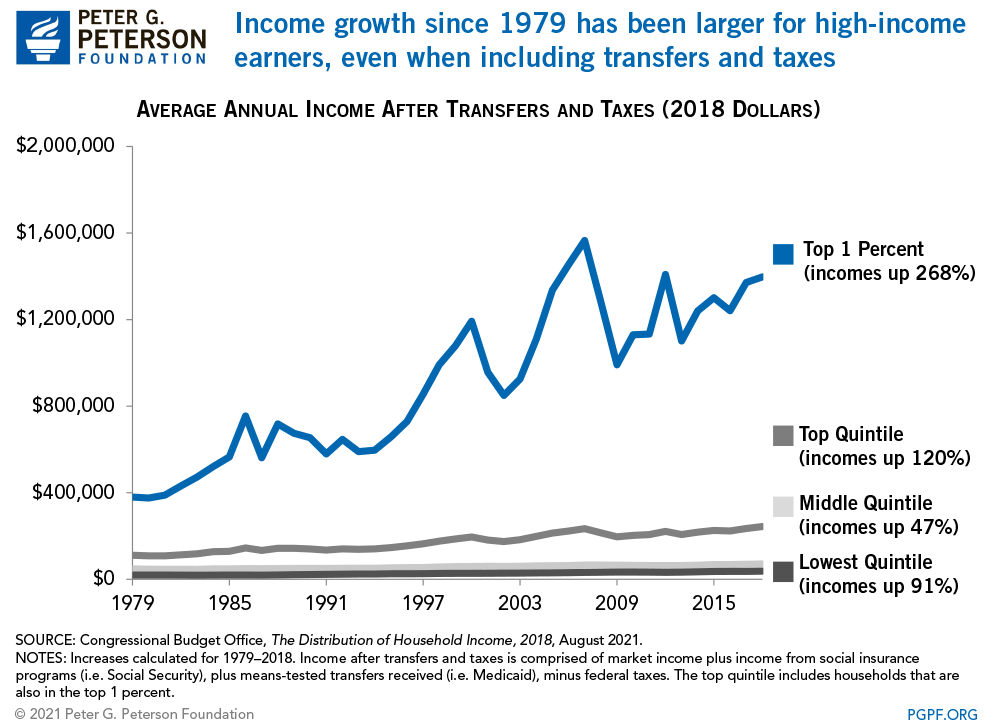
Income growth since 1979 is larger for high-income earners, even when including transfers and taxes.
https://www.pgpf.org/chart-archive/0059_income-growth-disparity
Between 1979 and 2016, income increased more quickly for high-income earners.
https://www.pgpf.org/chart-archive/0060_income-disparity-before-transfers-taxes
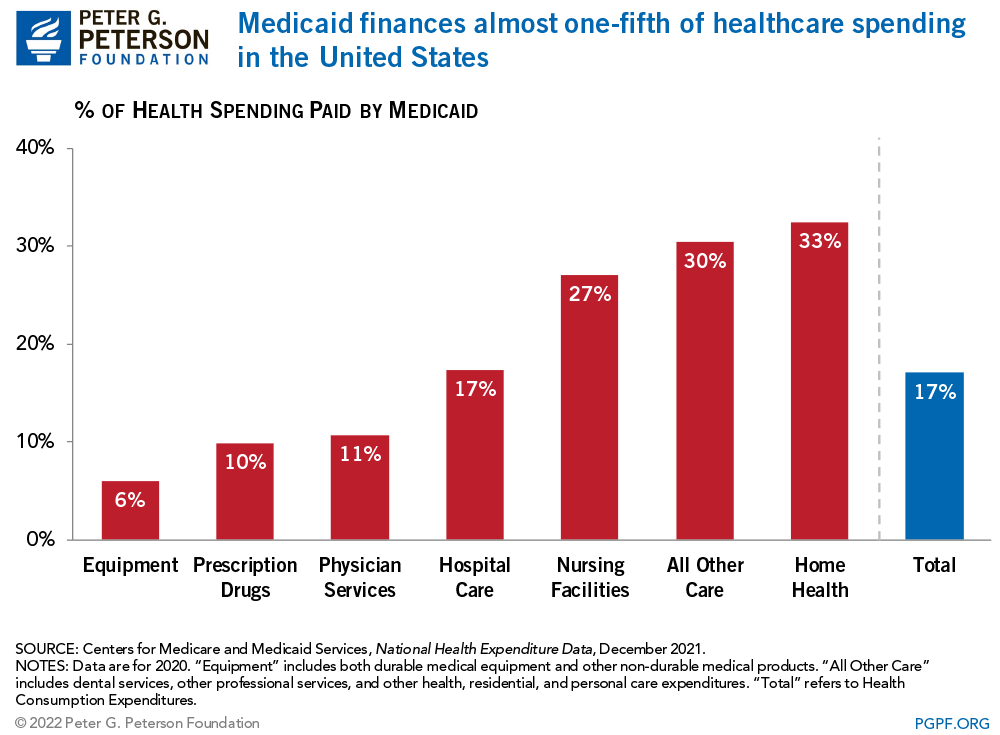
Medicaid finances almost one-fifth of healthcare spending in the United States.
https://www.pgpf.org/chart-archive/0095_medicaid_home_health
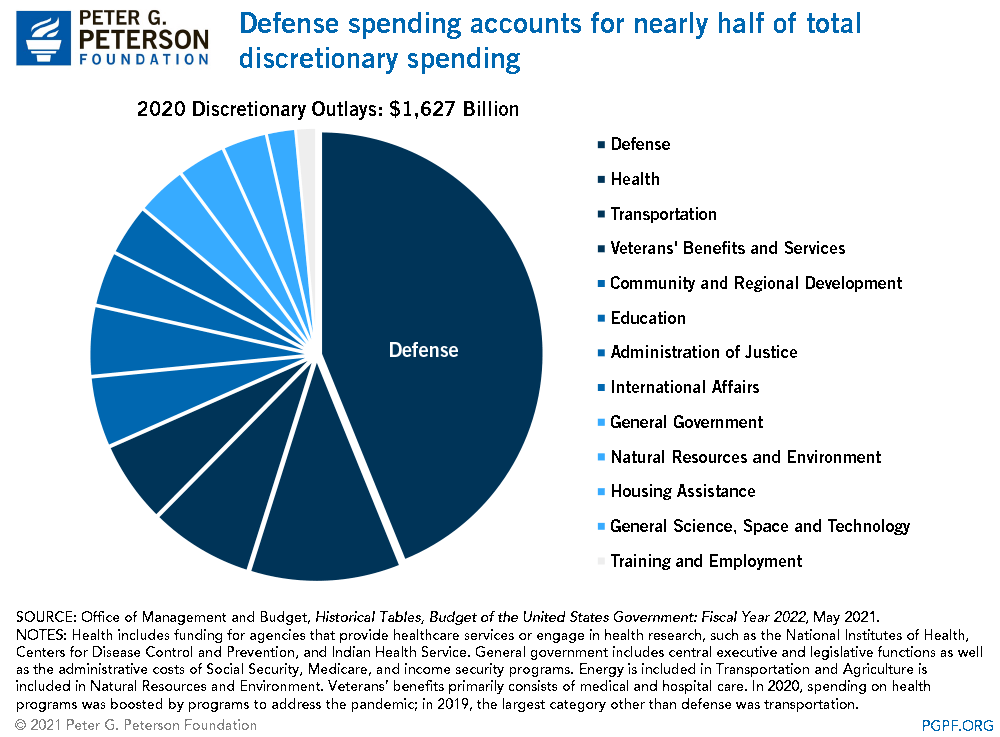
Defense spending accounts for nearly half of total discretionary spending.
https://www.pgpf.org/chart-archive/0070_discretionary_spending_categories
Discretionary spending is projected to remain below its historical average.
https://www.pgpf.org/chart-archive/0185_discretionary_spending