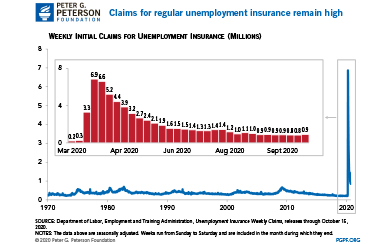
The Coronavirus Pandemic Continues to Cause Record Claims for Unemployment Insurance
Since March 15, more than 65 million claims for regular unemployment insurance have been filed due to COVID-19. Find weekly updated statistics here.
The search found 94 results in 0.243 seconds.
Since March 15, more than 65 million claims for regular unemployment insurance have been filed due to COVID-19. Find weekly updated statistics here.
A continuing resolution is a temporary funding measure that Congress can use to fund the federal government for a limited amount of time.
https://www.pgpf.org/blog/2024/03/what-is-a-continuing-resolution
The United States lost an estimated $1.8 trillion in revenues through tax expenditures in 2023.
https://www.pgpf.org/blog/2024/03/6-key-charts-on-tax-breaks
Recent news stories have highlighted the good news that very near-term deficits are decreasing. That good news, unfortunately, will be short-lived.
https://www.pgpf.org/blog/2014/02/good-news-about-improving-deficits-will-be-short-lived
Our most popular charts from 2016 illustrate the nation's fiscal challenges in areas like defense spending, healthcare, and tax reform.
https://www.pgpf.org/blog/2016/12/top-7-fiscal-charts-from-2016
These charts illustrate some of the biggest fiscal policy stories from 2017.
https://www.pgpf.org/blog/2017/12/ten-charts-that-sum-up-this-year-in-fiscal-news
One of the most fundamental responsibilities of the federal government is to set and pass a budget every year, allocating funding towards the nation’s needs and priorities.
Here are eleven charts that tell America’s fiscal story for 2019 — and show how our outlook went from bad to worse over the last 12 months.
https://www.pgpf.org/blog/2021/07/11-charts-that-show-how-our-national-debt-grew-in-2019
Lawmakers unveiled a tax overhaul framework recently, outlining a number of changes to individual and corporate taxes.
https://www.pgpf.org/blog/2017/10/five-charts-to-help-you-better-understand-individual-tax-reform
The Peterson Foundation has prepared analysis based on those reports, illustrating the key data points with pertinent chart information.
https://www.pgpf.org/blog/2015-social-security-medicare-trustees-reports-charts-and-analysis