
You are here
What Are the Economic Costs of Child Poverty?
Child poverty remains prevalent in the United States — the supplemental poverty measure (SPM), which accounts for many federal programs designed to assist low-income families, doubled over the past year for Americans under the age of 18, returning to pre-pandemic levels. What’s more, those rates are higher than other wealthy nations. Such trends are concerning, as evidence suggests that child poverty not only has long-lasting effects on health and education, but also quantifiable economic costs.
While the federal government also publishes information on the official poverty measure, which considers pretax money income alone, this analysis uses the SPM in order to capture changes to tax policy, noncash assistance, and shifts in necessary expenses over the years.
Child Poverty Remains a Structural Challenge in America
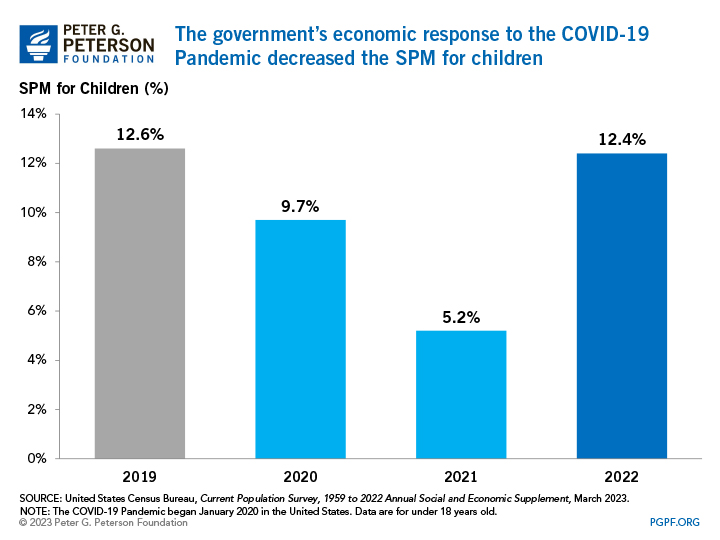
Child poverty has remained relatively high in the United States for much of the past decade, with the SPM averaging 16.2 percent from 2010 to 2019. During the COVID-19 pandemic, however, policymakers enacted legislation with a number of elements that help children, including stimulus checks, enhanced Earned Income and Child Tax Credits, and increased benefits for the Supplemental Nutrition Assistance Program. That assistance was largely responsible for a subsequent decline in child poverty, which fell from 12.5 percent in 2019 to 9.7 percent in 2020, and then to 5.2 percent in 2021.
However, when the COVID-19 relief and targeted tax benefits expired in 2022, there was a significant spike in the SPM for the whole population to 12.4 percent, which was near equivalent to pre-pandemic levels. That increase was the first since 2010 and the largest increase over any year on record.
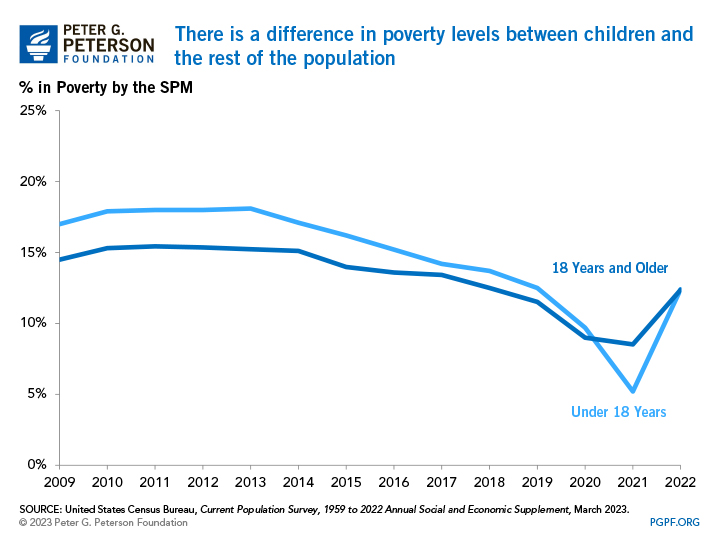
By comparison, the child poverty rate of 12.4 percent in 2022 was slightly higher for children compared to those 18 years or older (by 0.03 percent). Prior to the COVID-19 pandemic, child poverty was above that of the adult population — 12.5 percent for those under the age of 18 compared to 11.5 percent for those 18 years or older in 2019. Child poverty then dipped below the rate for adults during the pandemic due to federal assistance, but the expiration of that aid caused child poverty to rise above the rate for adults, returning to the pre-pandemic narrative. Generally, children experience higher rates of poverty than adults in the United States because of factors such as the cost of caregiving and its responsibilities, transitions to a single parenthood household, unemployment of parents, and disabilities of family members.
Child Poverty is Higher in the United States than in Other Wealthy Countries
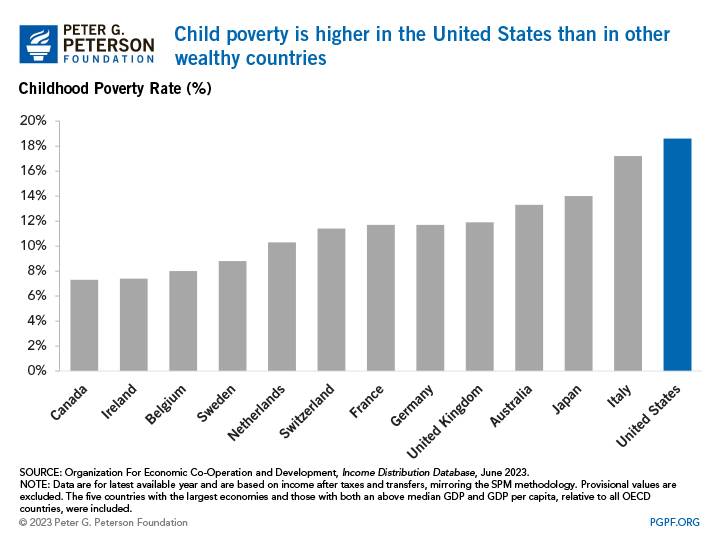
The rate of U.S. child poverty fares poorly when compared to the poverty rate of U.S. adults, as well as when compared to child poverty rates of peer countries. The United States has the highest rate of child poverty compared to other wealthy, developed nations, according to the most recent data from the Organization for Economic Co-Operation and Development (OECD). The U.S. child poverty rate was 18.6 percent, and the average for similar countries excluding the United States was 11.1 percent using data from 2021 (or the most recent data available for a country). Canada’s last recorded data was in 2020 and was the lowest rate in the comparison group at 7.3 percent. While OECD’s methodology for the child poverty rate is different from the SPM, it also accounts for governmental taxes and transfers.
The Economic Costs of Child Poverty
High levels of child poverty can impose a substantial economic cost to the United States. In 2018, a study by Michael McLaughlin and Mark R. Rank of Washington University in St. Louis measured the economic cost of child poverty by quantifying the costs of lower economic productivity, higher healthcare costs, and costs associated with crime, homelessness, and child maltreatment. The authors acknowledge that other important costs exist — such as emotional harm to children — but they are not easily quantifiable.
The largest economic cost of child poverty is the reduced future earning potential of children born into poverty. For adults who experienced poverty during childhood, earnings were reduced by a total of $294 billion compared to adults who did not experience poverty during childhood in 2015. The next largest costs are related to street crime and poor health. In all, child poverty reduced the size of the economy by an estimated $1 trillion dollars, or 5.4 percent of gross domestic product, in 2015.
Researchers measured the economic cost of child poverty in seven areas:
| Type of Cost | Economic Cost (Billions of Dollars) |
|---|---|
| Reduced Earnings | $294 |
| Increased victimization costs of street crime | 201 |
| Increased health costs | 192 |
| Increased corrections and crime deterrence costs | 123 |
| Increased child homelessness costs | 97 |
| Increased social costs of incarceration | 83 |
| Increased child maltreatment costs | 41 |
| Total | 1,030 |
SOURCE: Michael McLaughlin and Mark R. Rank, Estimating the Economic Cost of Childhood Poverty in the United States, March 2018.
NOTE: Components may not sum to total due to rounding.
© 2021 Peter G. Peterson Foundation
For each dollar spent to reduce poverty, McLaughlin and Rank estimated the government saves at least $7 on the future economic costs of poverty — making it a worthwhile investment, even from purely a budgeting standpoint.
Conclusion
It is unfortunate that child poverty remains a significant structural problem in the United States — and that the SPM for children doubled in 2022. In the longer term, a better understanding of the economic effects of child poverty can help policymakers make informed decisions about the most efficient use of federal dollars for anti-poverty programs and initiatives.
Related: How Much Government Spending Goes to Children?
Image credit: Photo by Spencer Platt/Getty Images