
You are here
How Do Marginal Income Tax Rates Work — and What if We Increased Them?

As Tax Day approaches, there is continuing discussion about the United States tax code — and especially marginal income tax rates. The Tax Cuts and Jobs Act (TCJA) made important changes to those rates, which affect millions of individual filers. Let’s look at how marginal tax rates and brackets work, and what the system — and potential changes to it — means for Americans.
How Is Income Taxed in the United States?
The federal government collects roughly half of its revenues by taxing individuals based on their incomes. The amount of income tax that is owed by each individual is partially determined by a series of tax brackets and marginal tax rates.
Individuals are taxed on income from a variety of sources, such as wages from a job, Social Security benefits, and capital gains. Most people derive the majority of their income from wages and salaries. Wealthier individuals tend to have capital gains, dividends, and interest earnings that account for a larger share of their total income.
Some income is not subject to taxation. For example, 88 percent of taxpayers take the standard deduction, which allows them to reduce their income by a fixed amount — $12,550 for single taxpayers and $25,100 for married couples filing jointly for 2021. The remaining 12 percent of taxpayers itemize their deductions, which means that their taxable income is adjusted based on specific financial activities such as charitable contributions and mortgage interest payments.
What Is a Tax Bracket?
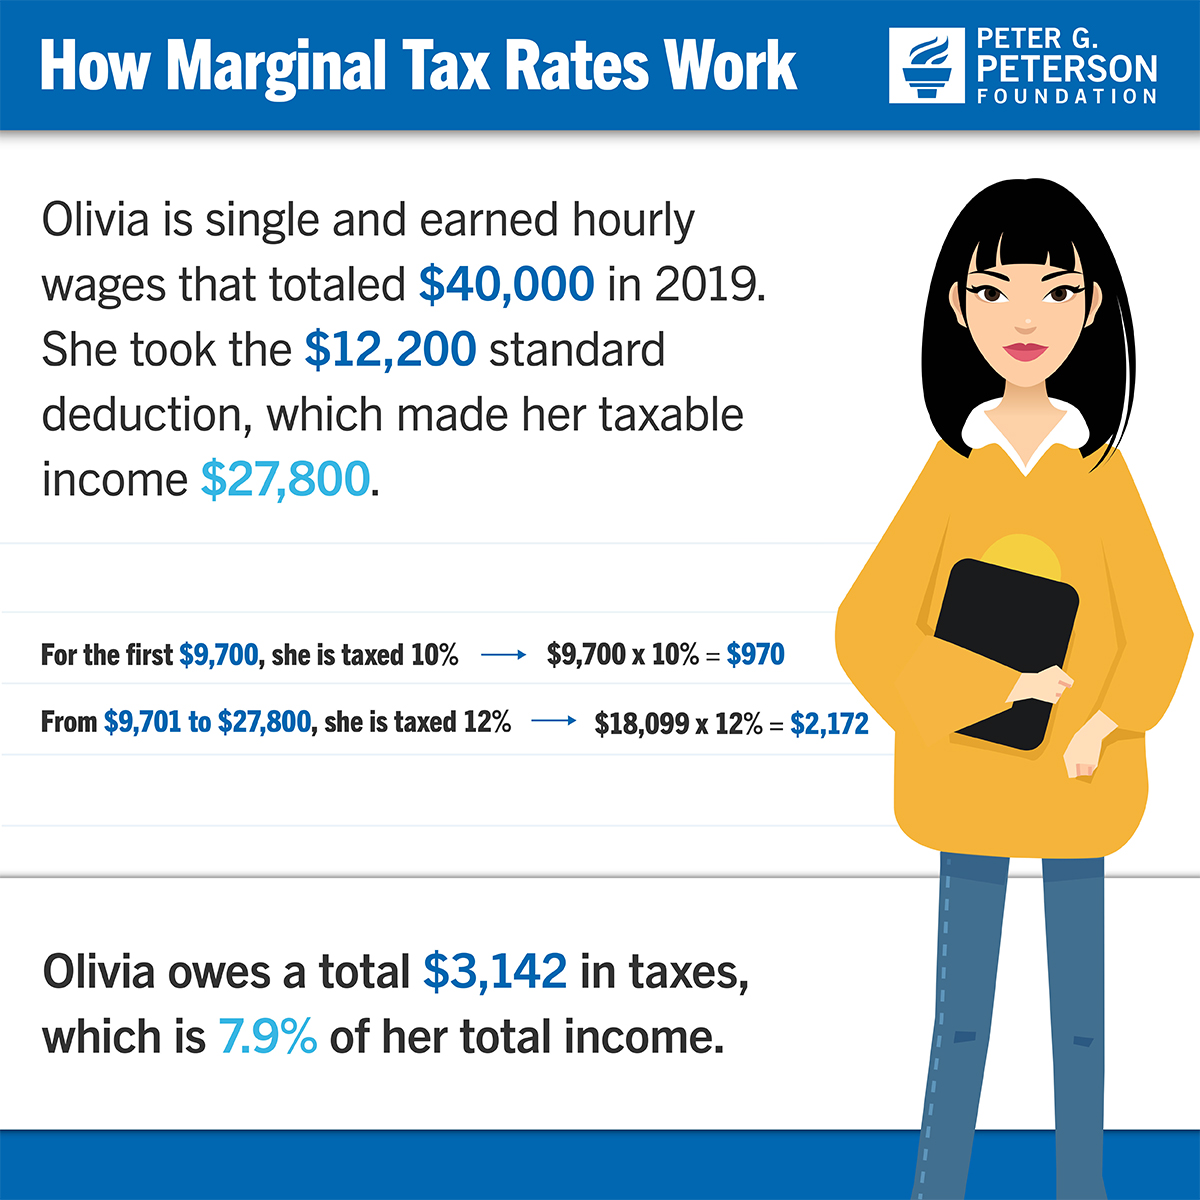
Tax brackets are (inflation-adjusted) ranges of taxable income that are subject to tax at a specified rate. The rate applied to each range of taxable income is referred to as the “marginal” rate. For example, in 2019, taxable income from $9,700 to $39,475 was taxed at a marginal rate of 12 percent for single individuals. A single individual with taxable income of $27,800 would pay 10 percent on the first $9,700 and 12 percent on the next $18,099.
What Are the Current Marginal Tax Rates?
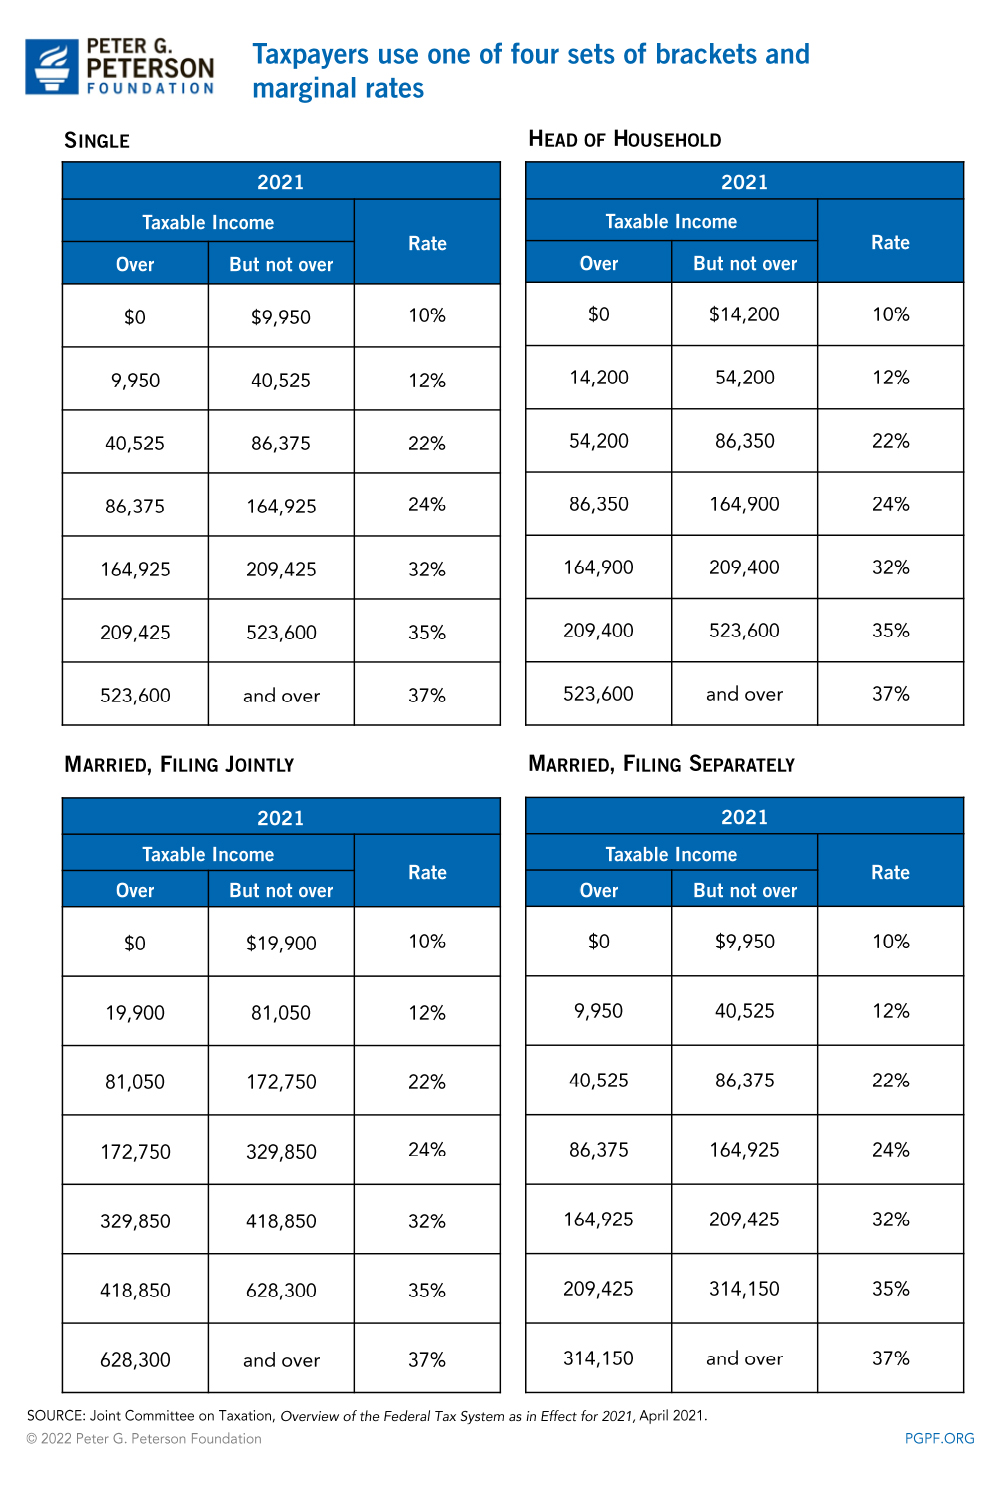
There are seven marginal tax rates in the current individual income tax system. Brackets that cover higher ranges of taxable income apply higher marginal rates. That design contributes to the progressivity of the federal income tax — individuals with higher incomes pay a larger share in taxes than do lower-income individuals.
For single taxpayers in 2021, the seven marginal rates ranged from 10 percent on the first $9,950 of income to 37 percent on the portion of income above $523,600. Those marginal rates reflect adjustments made in late 2017 as part of the TCJA. While all taxpayers face the same seven marginal rates, the taxable income ranges that are associated with each marginal rate vary across the four types of taxpayer.
How Do Current Marginal Tax Rates Compare to Those in U.S. History?
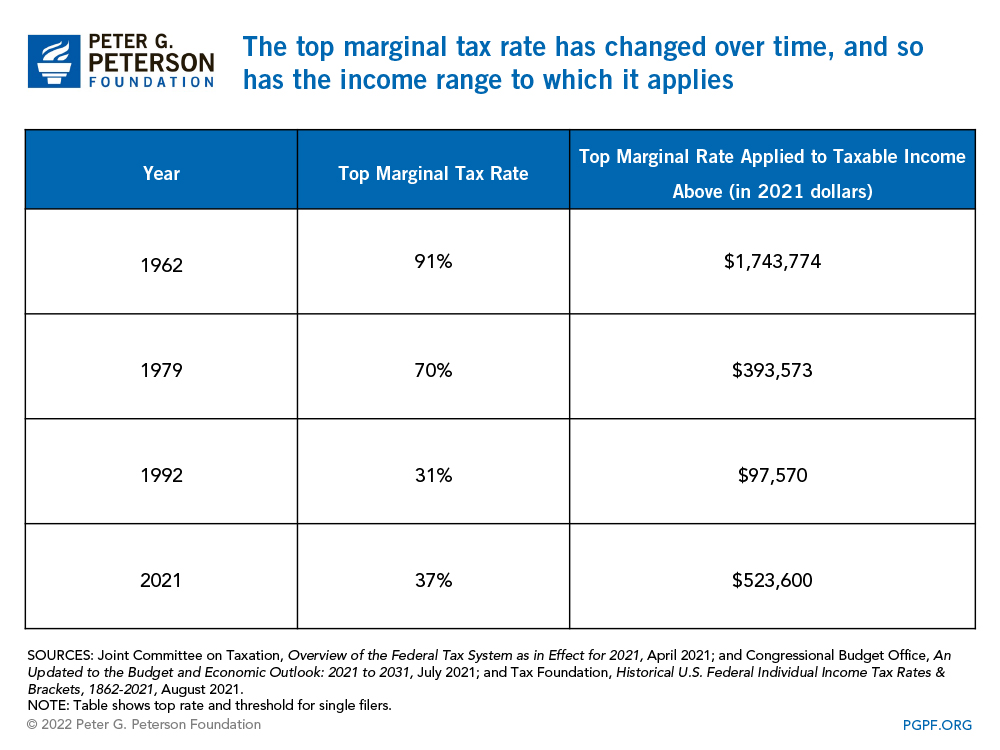
Marginal tax rates have changed significantly over time. For instance, the top marginal rate declined from 91 percent in 1962 to a low of 28 percent in the late 1980s. Since then, the top rate has fluctuated between 31 percent and 39.6 percent.
Changes to the top rate have been accompanied by changes to the level of income to which it applies. The top rate of 31 percent in 1992 was relatively low compared to other years in history, but it also applied to relatively low taxable incomes. Taxing income above $1.7 million (in 2021 dollars) at 91 percent, as was the case in 1962, and taxing income above $97,570 (in 2021 dollars) at 31 percent, as in 1992, are fundamentally different — despite the fact that they were both top brackets.
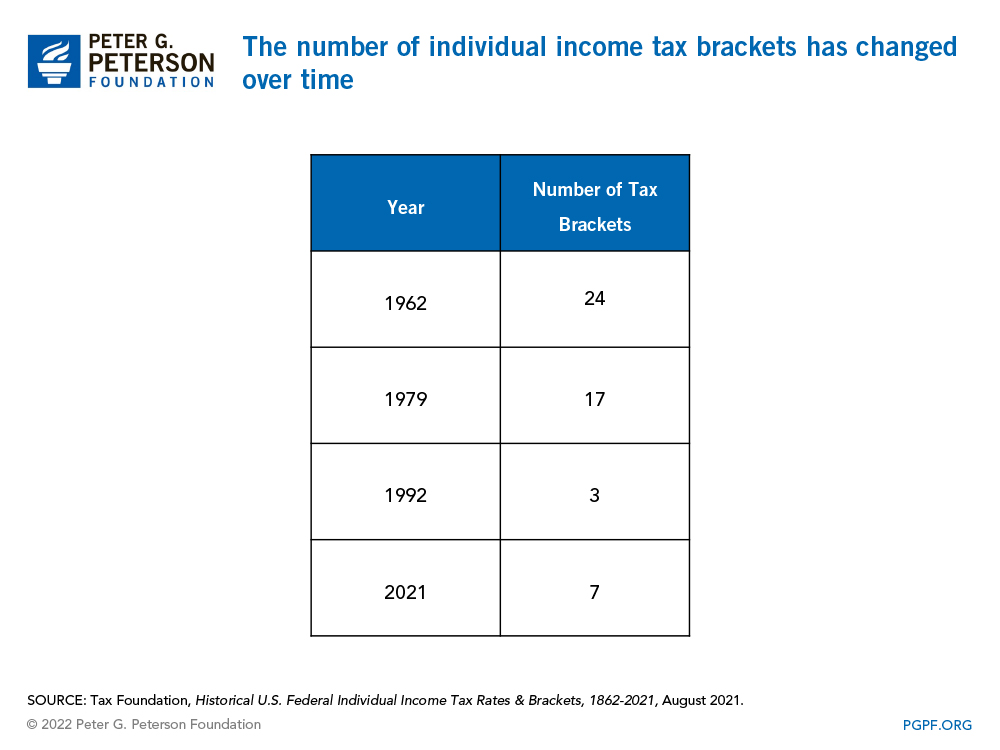
The total number of brackets has also changed over time. For much of the 1960s and 1970s, there were more than 20 brackets each year. Then, during the 1980s and early 1990s, the number of tax brackets declined, reaching a low of three in 1992 and 1993. Brackets were then gradually added back until the present number of seven was reached in 2013.
The Role of Tax Expenditures
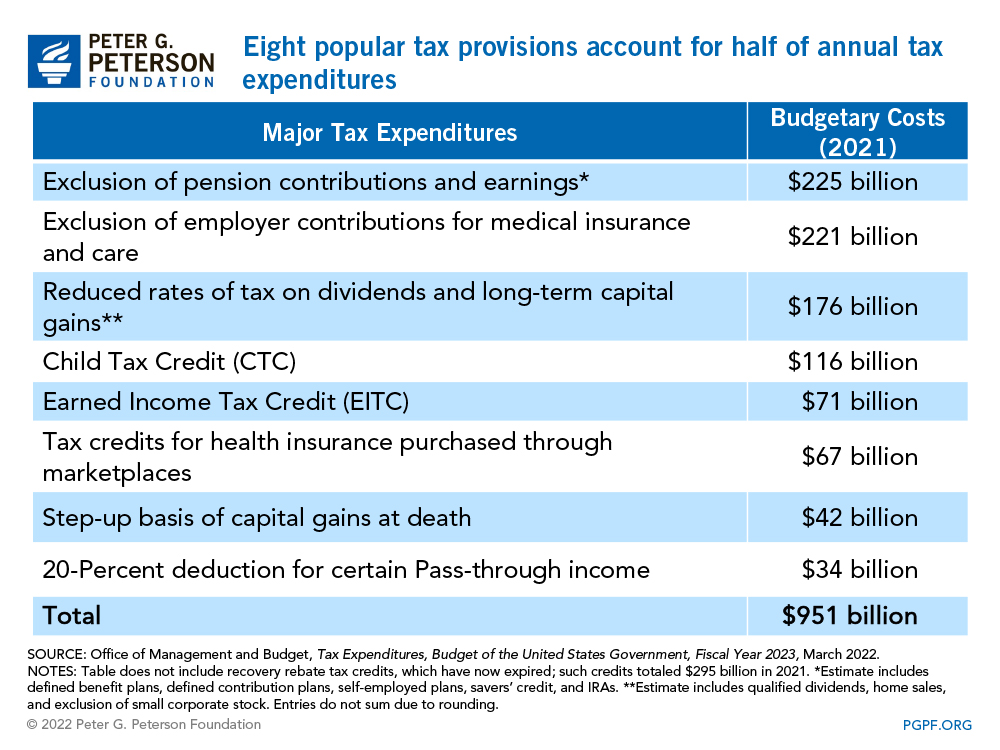
Tax expenditures — sometimes referred to as “tax breaks” — are provisions in the tax code that can reduce the amount that a taxpayer owes. They take several different forms — exclusions, exemptions, deductions, credits, preferential rates, and deferrals. For example, the amount that an employer contributes toward an employee’s health insurance premium is excluded from the employee’s income and is therefore not subject to taxation. Other examples include the preferential tax rates for certain capital gains and the mortgage interest deduction. The federal government uses tax expenditures to encourage certain activities, but it also collects fewer revenues as a result. The eight largest tax expenditures for 2021 are shown in the table below.
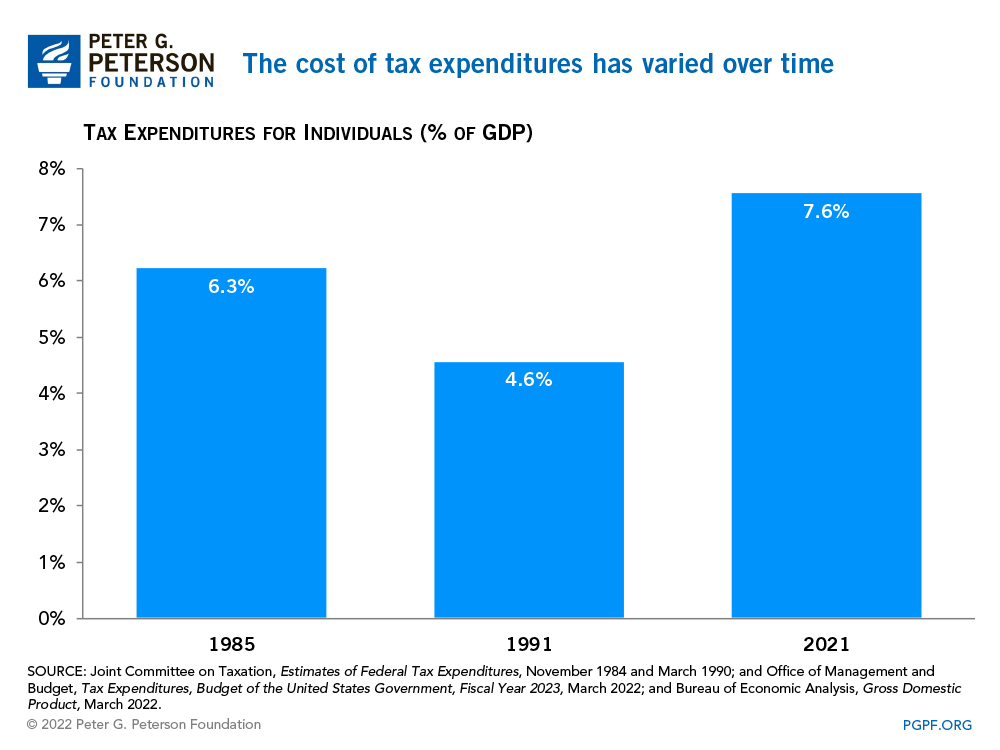
Tax expenditures further complicate historical comparisons of taxes because lawmakers have made significant changes to them over time. For example, the value of available tax expenditures relative to the size of the economy was significantly smaller in 1991 than it was in 2021. Therefore, it is difficult to make comparisons of tax rates in those two years. Taxable income of $150,000 in 1991 (in 2021 dollars) does not reflect the same taxable income of $150,000 in 2021, because taxpayers in the two years had varying opportunities to reduce their incomes for tax purposes. Comparing marginal rates between those two years requires a comparison of taxable incomes, but those taxable incomes describe fundamentally different circumstances — even after adjusting for inflation.
Average Tax Rates
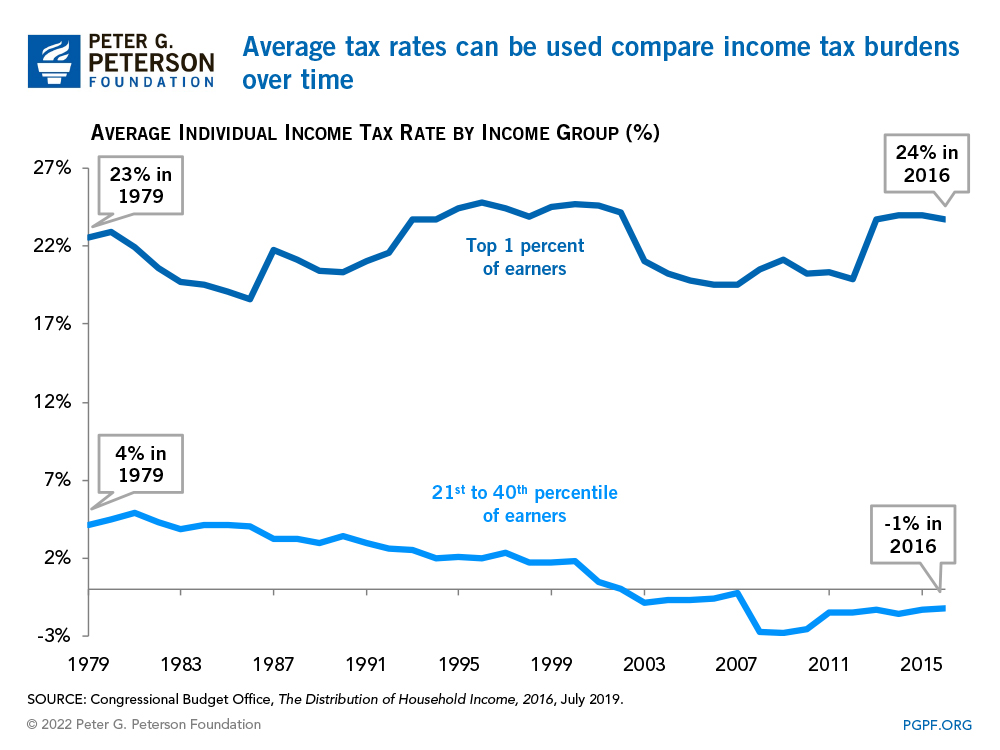
One way to compare the effect of income taxes over time is to compare average federal income tax rates for different income groups. Such figures account for the historical variability in tax policy — marginal rates, bracket ranges, and available tax breaks — and allow for a consistent historical comparison of the federal income tax. In 1979, the earliest year for which data are available, taxpayers in the 21st to 40th percentile of the income distribution had an average income tax rate of 4.1 percent. In 2016, the latest year for which data are available, their average tax rate had fallen to -1.2 percent; the negative rate means that those households had no tax liability and, on average, received a payment from the government from refundable tax credits. Over that same period, by contrast, taxpayers in the top 1 percent of the income distribution saw their average income tax rate rise slightly — from 22.6 percent to 23.7 percent.
How Does the Top Marginal Rate in the U.S. Compare to Top Marginal Rates in OECD Countries?
The Organisation for Economic Co-operation and Development (OECD) provides data that compares the top marginal tax rates of its member countries. According to that data, the top marginal rate in the United States was 46 percent in 2020 after factoring in social insurance and state income taxes. That combined top marginal rate ranked the United States 22nd highest out of 37 OECD countries.
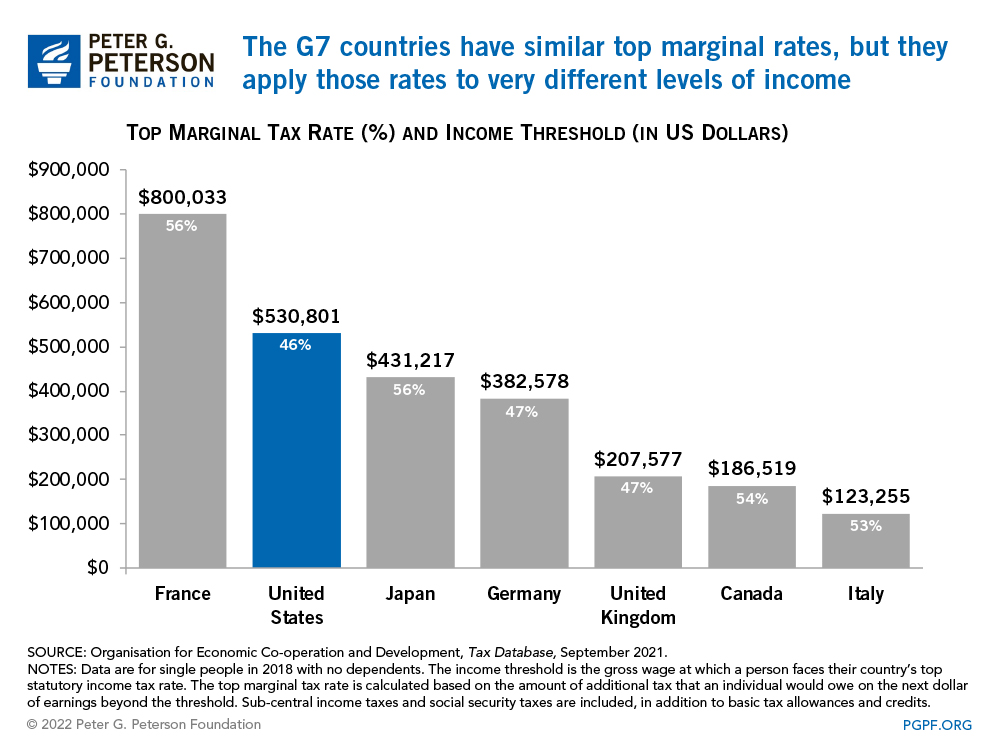
However, the top marginal rate does not tell the whole story. OECD countries not only have varying top rates, but those rates also kick in at different levels of income. For example, after accounting for income and social insurance taxes at the national and local levels, the United Kingdom and the United States had top marginal rates that were about the same in 2020. Yet the United Kingdom’s top rate applied starting at a gross wage of $207,577, whereas the top rate in the United States applied starting at a gross wage of $530,801. (Because OECD countries each have unique tax systems, taxable income is not an appropriate concept to use when making comparisons between those countries. The OECD uses gross wages, which includes all wage and salary earnings before most adjustments for taxation, because that concept is comparable across countries.)
Another important factor when comparing countries is the varying shapes of their income distributions. For example, in 2020, the top marginal rate in the United Kingdom applied starting at a gross wage that was 3.6 times greater than the country’s average wage. By contrast, the top rate in the United States applied beginning at a gross wage that was 8.8 times greater than the average wage.
What Could Be the Effects of Raising Marginal Tax Rates on High-Income Taxpayers?
A small increase in top marginal tax rates would raise revenues. For example, the Congressional Budget Office estimated the effect of raising marginal tax rates for the two highest brackets by one percentage point each. That analysis found that such a change would increase federal revenues by $114 billion (0.2 percent) from 2021 to 2030. A larger percentage increase would boost revenues by larger amounts.
A larger increase in top marginal income tax rates would also likely yield more revenues. In 2019, the Tax Foundation estimated the effect of adding a new bracket that would tax income over $10 million at a marginal rate of 70 percent. That analysis showed that it could raise $189 billion of additional revenues (an increase of 0.4 percent) over 10 years, after incorporating the effects of the change on economic growth.
In another analysis, academic economists Peter Diamond and Emmanuel Saez calculated that a 73 percent marginal tax rate would maximize the amount of revenues collected from those in the top bracket. While the federal income tax is the largest component of the 73 percent rate, it also includes state sales and income taxes and the Medicare payroll tax.
However, other economists question the assumptions used by Diamond and Saez. They claim that Diamond and Saez might not have properly accounted for the effects that a higher rate would have on occupational choice and business creation in the long run. They also argue that higher earners might reduce work hours and shift income to nontaxable sources more than Diamond and Saez assume. As a result of those differences, they conclude that the ideal top rate might be substantially lower than the top rate calculated by Diamond and Saez.
Two other factors could mitigate the revenue gains from making substantial increases to top marginal income tax rates. First, higher-income taxpayers have more resources to use in an attempt to avoid taxation. They can spend more on accountants and tax attorneys to find additional tax breaks.
In addition, many high-income individuals might not be affected by changes to marginal rates. For example, those in the top 1 percent of the income distribution derive a relatively high share of their income from capital gains. An increase in marginal rates on wages and salaries would have to be accompanied by an increase in the special rates on their other sources of income to have a demonstrable impact on those taxpayers.
Conclusion
The individual income tax is an important source of revenue for the federal government. As such, marginal income tax rates, bracket widths, and definitions of taxable income are policy parameters that have a significant impact on the country’s fiscal and economic health. Some lawmakers favor substantial increases to marginal tax rates, and some analyses show that such increases would yield additional revenues. However, it is unclear whether substantial amounts of revenue could be raised without simultaneously addressing other areas of the tax code such as tax expenditures.
It is undeniable that the United States has a structural imbalance between spending and revenues, so conversations about ways to close that gap are important. Any debate about revenue options should include the broad array of tools that are available to lawmakers.
Related: Four Simple Scenarios that Show How Marginal Rates and Tax Breaks Affect What People Actually Pay
Image credit: Photo by iStock/Getty Images