
You are here
Income and Wealth in the United States: An Overview of Recent Data

Government surveys collect a wide range of information about the population of the United States that contain useful insights about Americans’ economic status. Three annual surveys conducted by the U.S. Census Bureau include data on household income and wealth. The American Community Survey (ACS) provides income data at the state and local levels; the Current Population Survey Annual Social and Economic Supplement (ASEC) presents national-level income data for various demographic categories; and the Survey of Income and Program Participation (SIPP) offers data on household wealth. Below are several measures of income and wealth from those three surveys. The data depicts money income, which is pretax money before the application of tax liabilities or credits.
Income Levels Vary Across Geography, Race, and Gender
According to the ASEC, median household income was $74,580 in 2022, which is about a 2 percent decrease from the median household income in 2021 and nearly a 5 percent decrease from 2019 — the year before the start of the pandemic and subsequent recession. Looking at data for national averages, however, may mask important differences by region, race, level of education, or other categories.
The table below shows that median income varies by region — for example, it is higher for households in the West and Northeast than it is for those in the Midwest and South.
The Northeast and West have higher median household incomes than the Midwest and South
| Region | 2021 Median Household Income (2022 dollars) | 2022 Median Household Income |
|---|---|---|
| United States | $76,330 | $74,580 |
| West | $85,650 | $82,890 |
| Northeast | $83,540 | $80,360 |
| Midwest | $76,700 | $73,070 |
| South* | $68,330 | $68,230 |
SOURCE: United States Census Bureau, Current Population Survey, 2022 and 2023 Annual Social and Economic Supplements. September 2023.
NOTE: An asterisk indicates the year-over-year change is not statistically significant at the 90 percent confidence level.
© 2023 Peter G. Peterson Foundation
The ACS provides income data for states, the District of Columbia, and Puerto Rico. The table below shows the wide discrepancy in household incomes across the United States in 2022. The median household in the District of Columbia, the surveyed location with the highest income, had an income that was around four times that of the median household in Puerto Rico, the surveyed location with the lowest income.
Median household incomes vary widely across the United States
| State/District/Territory | 2022 Median Household Income |
|---|---|
| District of Columbia | $101,027 |
| New Jersey | $96,346 |
| Maryland | $94,991 |
| West Virginia | $54,329 |
| Mississippi | $52,719 |
| Puerto Rico | $24,112 |
SOURCE: U.S. Census Bureau, 2022 American Community Survey 1-Year Estimates,September 2023.
© 2023 Peter G. Peterson Foundation
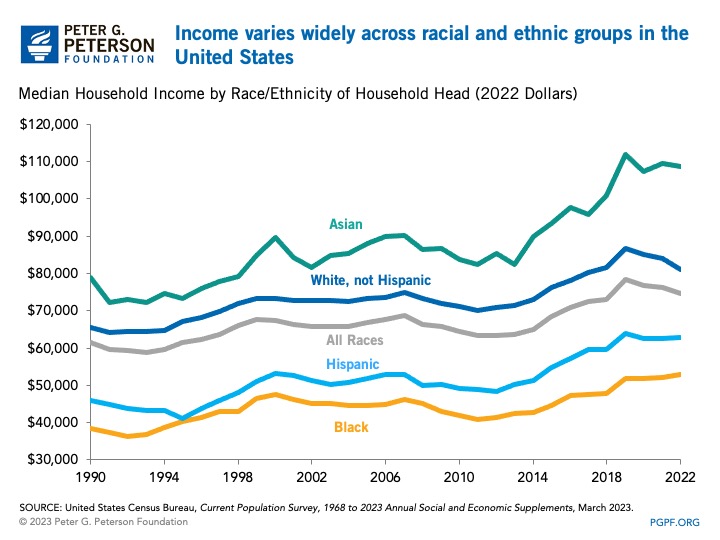
Income also varies by race and ethnicity. The table below shows median household income grouped by the race and ethnicity of the head of household. In 2022, households whose head identified as Asian or White had median incomes higher than the national median, while households led by people who identified as Black or Hispanic had median incomes that were lower than the national median.
In 2022, median household income varied considerably by race and ethnicity
| Race/Ethnicity of Household Head | 2021 Median Household Income (2022 dollars) | 2022 Median Household Income |
|---|---|---|
| All races/ethnicities | $76,330 | $74,580 |
| Asian* | $109,400 | $108,700 |
| White, not Hispanic | $84,110 | $81,060 |
| Hispanic (any race)* | $62,520 | $62,800 |
| Black* | $52,080 | $52,860 |
SOURCE: United States Census Bureau, Current Population Survey, 2022 and 2023 Annual Social and Economic Supplements. September 2023.
NOTE: An asterisk indicates the year-over-year change is not statistically significant at the 90 percent confidence level.
© 2023 Peter G. Peterson Foundation
Median household income by race and ethnicity has generally risen over the past 30 years, even after adjusting for inflation. More recently, growth in income was higher in the three years before the pandemic started, from 2017 to 2019, compared to the three years following, from 2020 to 2022. From 2017 to 2019, income for all races rose by 8 percent; from 2020 to 2022, incomes have risen by only 3 percent for all races, although those numbers vary by demographic group.
The table below shows median household income grouped by educational attainment of the household head. Households led by an individual 25 years of age or older with a bachelor’s degree or more have incomes that are considerably higher than the national median. Households led by an individual aged 25 or older with less than a high school diploma earn less than half of the national median.
Median household income varies based on the educational attainment of the household head
| Educational Attainment of Household Head | 2022 Median Household Income |
|---|---|
| All education levels | $75,980 |
| No high school diploma | $34,850 |
| High school or equivalent | $51,470 |
| Some college, including Associate's degree* | $68,690 |
| Bachelor's degree or more | $118,300 |
SOURCE: United States Census Bureau, Current Population Survey, 2022 and 2023 Annual Social and Economic Supplements, September 2023.
NOTE: The data above is for household heads who are 25 or older. An asterisk indicates the year-over-year change is not statistically significant at the 90 percent confidence level.
© 2023 Peter G. Peterson Foundation
The ASEC also gathers data on earnings by sex. In 2022, the median earnings for full-time, year-round male workers was about $10,000 higher than the median earnings for full-time, year-round female workers.
Male workers earn more than female workers
| Full-Time, Year-Round Workers | 2021 Median Individual Earnings (2022 Dollars) | 2022 Median Individual Earnings |
|---|---|---|
| Men | $65,970 | $62,350 |
| Women | $55,240 | $52,360 |
SOURCE: United States Census Bureau, Current Population Survey, 2022 and 2023 Annual Social and Economic Supplements. September 2023.
NOTE: A full-time, year-round worker is a person who worked at least 35 hours per week (full time) and at least 50 weeks per year (year-round).
© 2023 Peter G. Peterson Foundation
Wealth is an Important Component of Americans’ Economic Status
When it comes to describing the financial status of Americans, income does not tell the whole story. Income measures the flow of money and other assets during a given period whereas wealth measures the stock of money and other assets that have accumulated at a certain point in time. For example, a household that saves $5,000 each year would have $25,000 of additional wealth at the end of five years.
Wealth is measured through a concept called net worth. Net worth is the difference between a household’s assets and debts. For example, if a household has $10,000 in its checking account, $40,000 of student debt, and $5,000 of credit card debt, then it has a net worth of -$35,000.
The table below shows median net worth in 2021 by education level. (SIPP data for 2022 have not yet been published.) It illustrates how net worth, on average, is higher for households with a higher level of educational attainment.
Household net worth varies by education
| Highest Level of Educational Attainment in Household | Median Net Worth in 2021 |
|---|---|
| No High School diploma | $8,460 |
| High School graduate | $55,030 |
| Some college, no degree | $90,810 |
| Associate degree | $139,000 |
| Bachelor's degree | $266,600 |
| Graduate or professional degree | $555,900 |
SOURCE: United States Census Bureau, Wealth of Households: 2021, June 2023.
© 2023 Peter G. Peterson Foundation
The ASEC, ACS, and SIPP contain data for many more demographic categories, such as occupation, family structure, marital status, and number of children. Such data highlights variations among populations in the United States and can help lawmakers evaluate policies to address such differences.
Related: CBO: Income Inequality Continues to Rise
Image credit: IP Galanternik D.U.