
You are here
Decade in Review: Looking Back at CBO Projections Then and Now

The United States added about $9 trillion of debt over the past decade, and debt measured as a share of the economy has risen to its highest level since shortly after World War II. As one decade ends and another begins, there’s no question that our fiscal outlook is daunting. But as we mark this milestone, it’s also helpful to take a closer look at projections from 10 years ago to assess how decisions by lawmakers and other factors have contributed to our fiscal outlook.
How Has the Fiscal Outlook Changed over the Past Decade?
Each year, the Congressional Budget Office (CBO) publishes multiple projections of the fiscal outlook, which cover periods ranging from 10 years to 30 years into the future. By comparing the projections from 2010 with those from 2019, we can gather a sense of how the fiscal outlook has changed over the past decade.
Current-Law Projections
Projections of the federal budget often start with a benchmark, or baseline, that looks at spending and revenues under the assumption that current laws remain in place. Under this baseline projection, the fiscal outlook worsened over the past decade. In 2010, the Congressional Budget Office (CBO) projected that debt would equal 90 percent of gross domestic product (GDP) in 2049. But by 2019, CBO was projecting a substantially larger debt in 2049 — 144 percent of GDP.
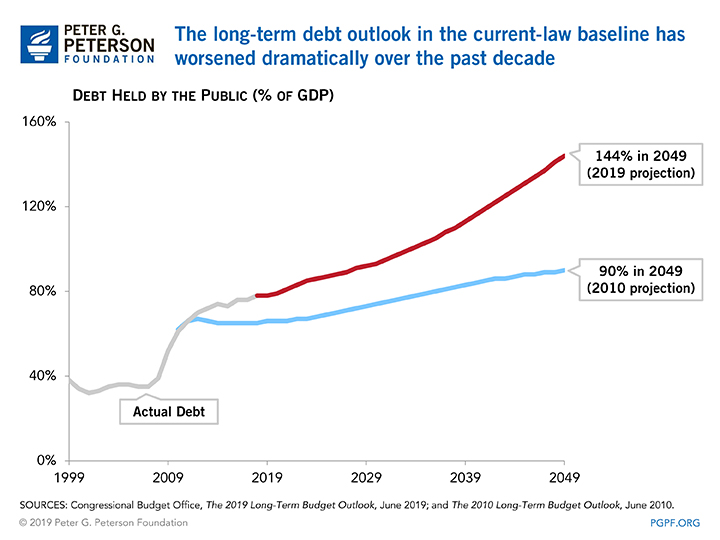
This decline in the fiscal outlook is the net result of several factors. In particular, debt turned out higher than projected because of lower-than-projected revenues as well as increased spending for some mandatory programs; those effects were partially offset by lower spending on interest, annual appropriations, and Medicare.
Such differences can be quantified by comparing actual spending and revenues for 2010 through 2018 with projections made in 2010. The rise in projected debt stems mostly from:
- Revenues. The 2010 projection assumed that tax cuts passed in 2001 and 2003 would expire as originally scheduled at the end of 2010. Ultimately, many provisions of that legislation were extended permanently, which meant that actual revenue collections were much lower than CBO projected in 2010. The 2019 debt projection incorporates those extensions in addition to additional tax cuts that were enacted in 2017. Furthermore, GDP grew more slowly from 2010 through 2018 than CBO originally anticipated, resulting in a smaller economy from which to collect taxes.
- Other mandatory spending. Spending from 2010 through 2018 for mandatory programs other than Medicare came in $423 billion higher than CBO projected in 2010. Spending on veterans’ benefits was ultimately higher than what was originally projected, and policymakers enacted new legislation that increased outlays for the refundable portions of tax credits.
Three factors caused debt to be lower than anticipated:
- Interest rates. Rates paid on government debt turned out lower than projected 10 years ago. For example, the 2010 baseline assumed that interest rates on 10-year notes would average 3.1 percent from 2010 through 2018; in reality, the 10-year interest rate averaged 2.4 percent over that period. Despite debt coming in higher than anticipated, the government spent $1.5 trillion less on interest costs between 2010 and 2018 than the amount that CBO projected in 2010.
- Discretionary spending. In 2010, CBO projected that outlays from annual appropriations, known as discretionary spending, would total $12.4 trillion from 2010 through 2018. Actual discretionary spending was $1.3 trillion lower — totaling $11.2 trillion in those years.
- Medicare spending. CBO’s 2010 projection assumed Medicare spending would total $5.3 trillion from 2010 through 2018, but it was actually $4.7 trillion over that period.
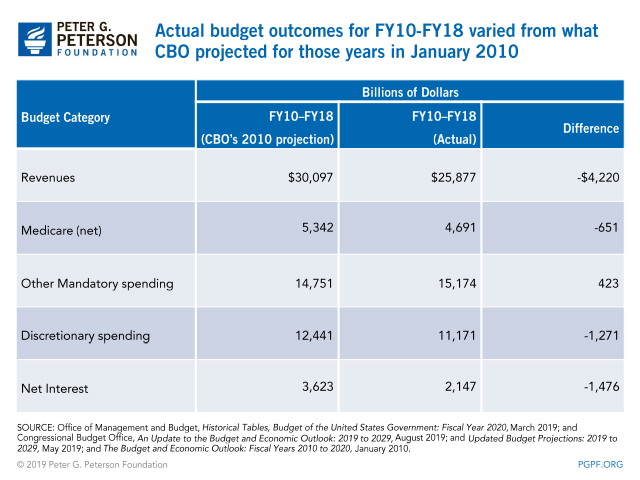
The net effect of those factors is that debt in 2019 was $2 trillion higher than CBO had anticipated for that year in its 2010 projections. Despite a decade of lower-than-projected interest costs and less-than-anticipated spending on Medicare and discretionary programs, the budgetary effect of decisions about tax policy and other revenue effects during the 2010s was larger and therefore led to an overall deterioration in long-term projections of federal debt. Those effects are reflected in CBO’s latest baseline projections through 2049.
Alternative Fiscal Scenario (AFS)
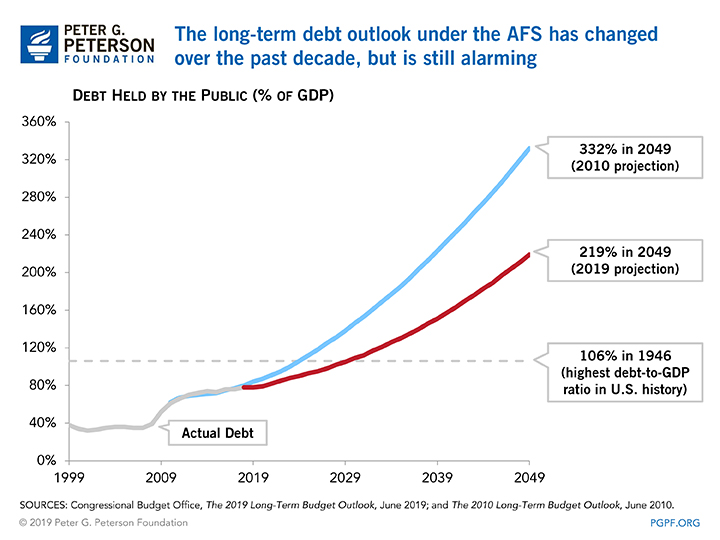
In addition to its baseline projection, CBO publishes an alternative fiscal scenario (AFS), which assumes that certain policies will be extended even if current law dictates that they would expire. CBO’s 2010 AFS projected that debt would reach 332 percent of GDP by 2049. The 2019 AFS projected a debt-to-GDP ratio of 219 percent of GDP in 2049. While that is well below the AFS projection of 10 years ago, such a level of debt would be very high relative to historical standards.
The change in the long-term debt projection under the AFS is a result of lower levels of projected spending. In the 2010 AFS, CBO projected that spending would reach 45 percent of GDP in 2049, but the 2019 AFS projects 2049 spending of 33 percent of GDP. That reduction results from changes in the projections of three areas of spending:
- Major Health Programs. Spending on healthcare in the U.S. relative to economic growth has slowed down noticeably over the past decade. Mostly as a result of that phenomenon, the 2019 AFS projected that spending on the major health programs would be about 9 percent of GDP in 2049 – down from the 2010 AFS projection of roughly 12 percent of GDP. (The major health programs are Medicare, Medicaid, the Children’s Health Insurance Program, and subsidies for the purchase of health insurance.)
- Other Noninterest Outlays. In the 2010 AFS, other noninterest outlays were projected to reach 9.1 percent of GDP by 2049. However, using up-to-date information about current spending, the 2019 AFS projected that such spending would be equal to about 8 percent of GDP in 2049. (Other noninterest outlays include all discretionary spending plus mandatory spending for programs other than Social Security and the major health programs. The category includes budget functions as varied as national defense activities and income security programs.)
- Interest Costs. Interest rates during the 2010s turned out to be much lower than anticipated and current projections incorporate relatively low rates in the future. Consequently, while the 2010 AFS projected that spending on net interest would reach 16 percent of GDP in 2049, the 2019 AFS projected that net interest spending would rise to about 9 percent of GDP in 2049.
Those changes to CBO’s AFS projection were so substantial that they more than offset the effects of a decline in projected revenues. The 2010 AFS had assumed that revenues would be equal to 19.3 percent of GDP in 2020 and that they would remain at that level indefinitely. By contrast, the 2019 AFS, which includes the revenue reductions resulting from the 2017 tax act and the assumption that many of its provisions will be extended indefinitely, as well as the revenue developments that affected the current-law projection since 2010, anticipates that revenues will reach 17.6 percent of GDP by 2049. Such a decline in projected revenues would have made the AFS debt picture look worse in 2019 than it did in 2010, but the three spending factors listed above more than offset the effect of lower revenues.
Where Are We Headed from Here?
Regardless of which set of assumptions is used, the long-term fiscal outlook is daunting. Under the current-law projections, debt would be about 1.5 times as large as the U.S. economy in 30 years; using less favorable assumptions, recent projections suggest that it could be more than twice as large as the economy. In either case, it’s clear that our fiscal outlook presents challenges to our economy, and the sooner lawmakers begin to manage the rapidly rising debt, the better off future generations will be.
Related: $9 Trillion Added To The National Debt Over The Last Decade
Image credit: Photo by Getty Images