
You are here
5 Facts About Rising Income Inequality in the United States
Income inequality in the United States continues to rise, according to a new report from the Congressional Budget Office that utilizes data through 2020. Below are five facts about changes in income inequality over the past 40 years and how government policies can influence those trends.
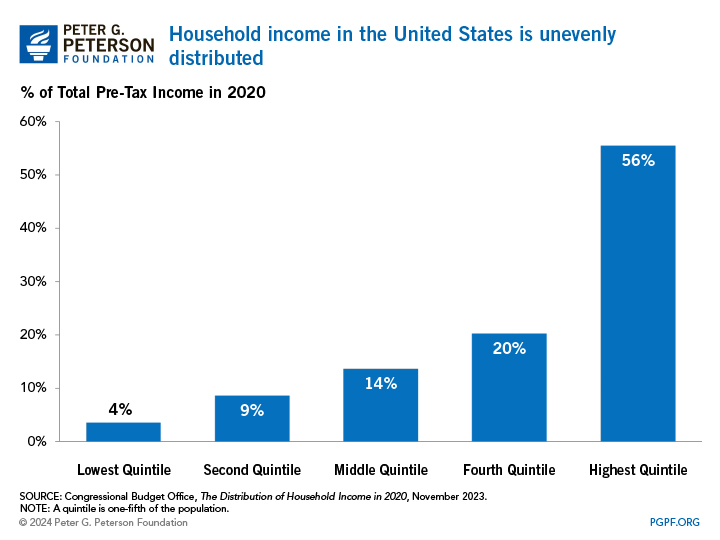
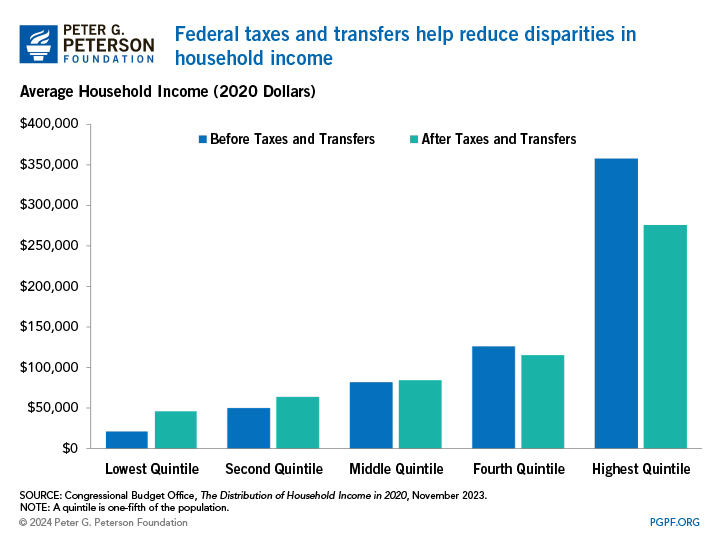
- Household income in the United States is unevenly distributed.
In 2020, average income before taxes and transfers among households in the lowest fifth of the income distribution was $21,900 but averaged $357,800 for the highest fifth of the distribution. What’s more, the top 1 percent of households made almost five times as much income as the bottom 20 percent of households.
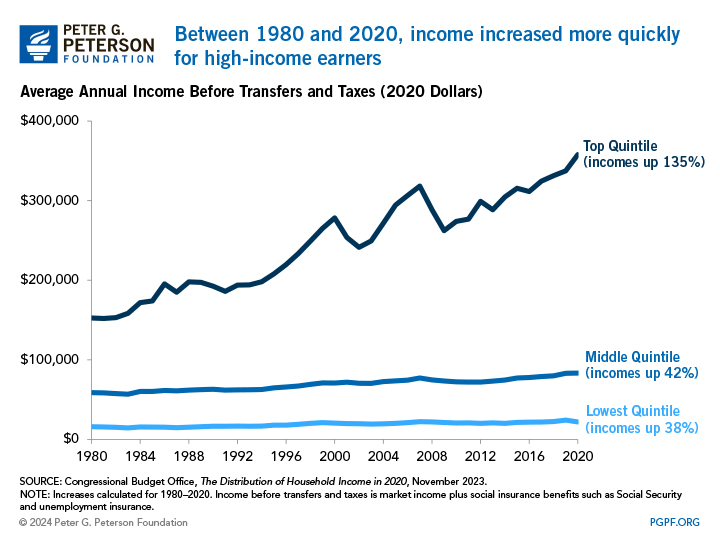
- The concentration of income toward high earners has become more pronounced since 1980.
Over the past four decades, average household income grew by 80 percent after adjusting for inflation; however, that growth was not equally shared. Average income in the highest quintile (one-fifth of the population) was 135 percent higher in 2020 than it was in 1980 – over three and a half times the growth in average income in the lowest quintile (which grew 38 percent over the period). Those statistics do not account for the effect of taxes or transfer programs such as Medicaid, the Children’s Health Insurance Program, and the Supplemental Nutrition Assistance Program; such programs provide cash payments or other forms of assistance to people with relatively low income or few assets..
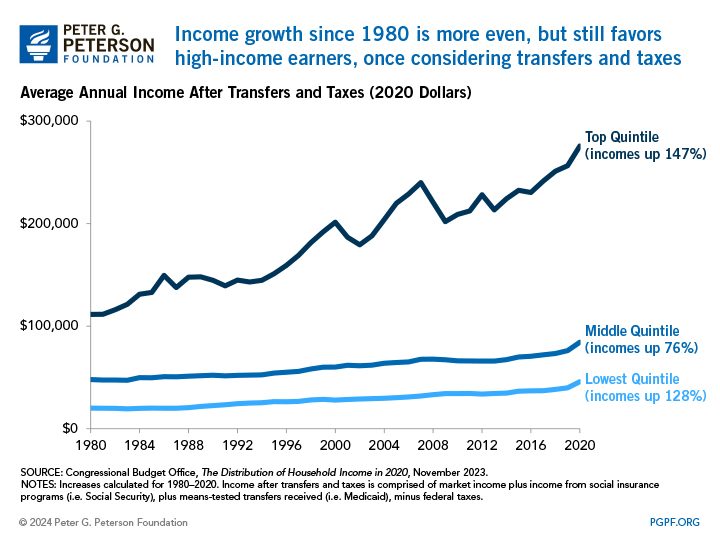
- Income is more evenly distributed once taxes and transfers are taken into account.
When the tax code and transfer programs are taken into account, income growth is still unequal, but is more evenly distributed among Americans. In the case of the lowest quintile, the incorporation of taxes and transfers shows that income growth from 1980 to 2020 was 128 percent (rather than 38 percent without those factors incorporated).
- The progressive tax code plays an important role in reducing income inequality.
Federal taxes are generally progressive, which means that higher-income households pay a larger share of their income than do lower-income households. After taxes, income inequality remains, but the disparity among groups is reduced.
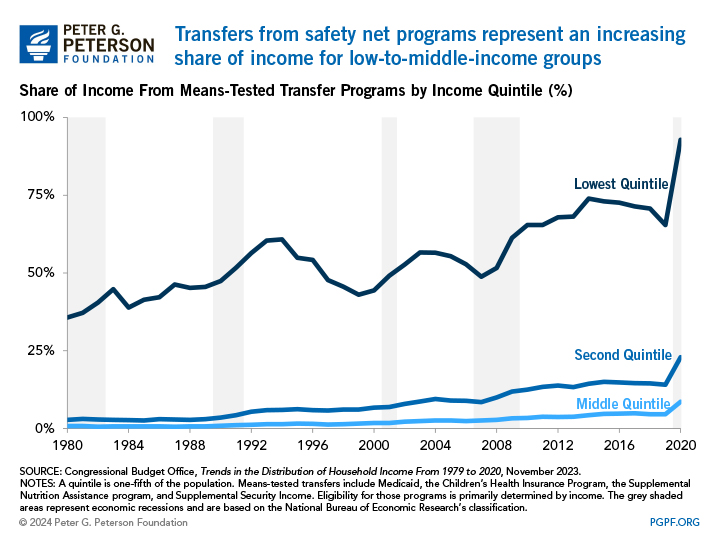
- Means-tested transfer programs benefit lower-income households.
Since 1980, benefits from means-tested transfer programs have increased as a share of income accrued by low, second, and middle quintile households. For the lowest income quintile, transfers represented 64 percent of average household income in 2019 — an increase of 30 percentage points from the 1980 level. That number increased significantly in 2020, reaching 93 percent of average household income, primarily due to heightened transfer benefits from the federal response to COVID-19.
Income inequality remains, and has risen noticabely over the past few decades. While taxes and transfers decrease the income discrepancy between low- and high-income individuals, they do not close the gap. The unshared benefits of a developing economy have negative implications, such as poverty levels differing by race, ethnicity, and sex. Understanding the growth of income inequality over time and how federal dollars can influence that trend is essential to building a more inclusive and robust economy for the future.
Related: Income and Wealth in The United States: An Overview of Recent Data
Image credit: Spencer Platt/Getty Images