
You are here
14 Charts That Illustrate Our Fiscal Situation as We Close Out 2021

The coronavirus (COVID-19) pandemic and the legislative response to it had a significant effect on our nation’s budget, fiscal outlook, and economic condition. Lawmakers provided substantial fiscal support to help the nation recover from the pandemic; in addition, they subsequently enacted legislation that would boost federal investment in America’s infrastructure over the next few years. The Congress is now considering a major reconciliation bill for new spending on various national priorities as well as ways to pay for those priorities.
Even before the pandemic, though, America was on an unsustainable fiscal path — driven primarily by the rising cost of healthcare and aging of the population combined with inadequate revenues to cover those commitments. That structural imbalance will grow as interest costs mount, which will continue to increase the national debt and threaten America’s economic future.
Below are 14 charts that tell the fiscal story of 2021 — looking back at how our fiscal situation deteriorated over the past year and what challenges lie ahead.
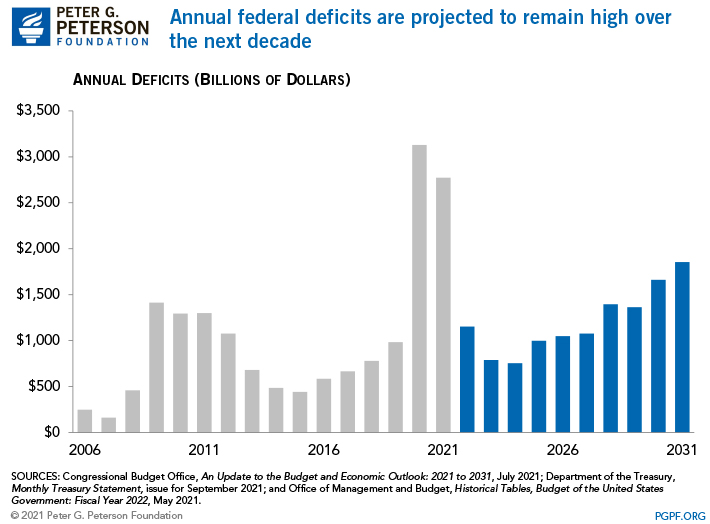
- The deficit in 2021 totaled $2.8 trillion — the second highest amount in U.S. history.
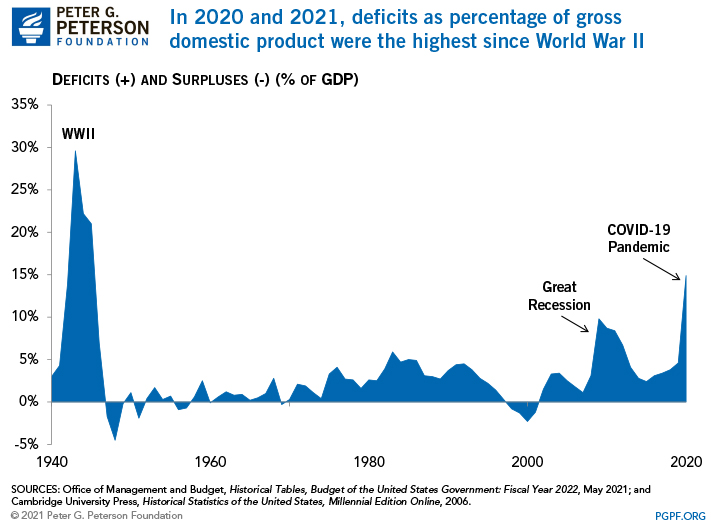
- Recent deficits relative to the size of the economy were the highest since World War II.
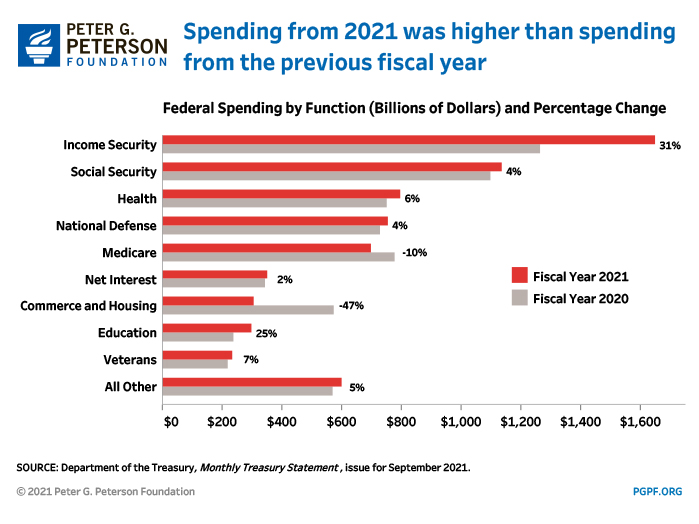
- Spending was higher in 2021 than in the previous year.
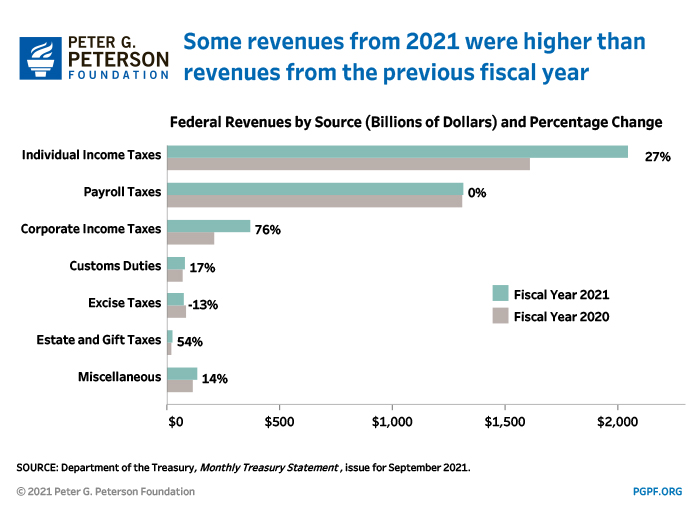
- Revenues also increased significantly in comparison to 2020.
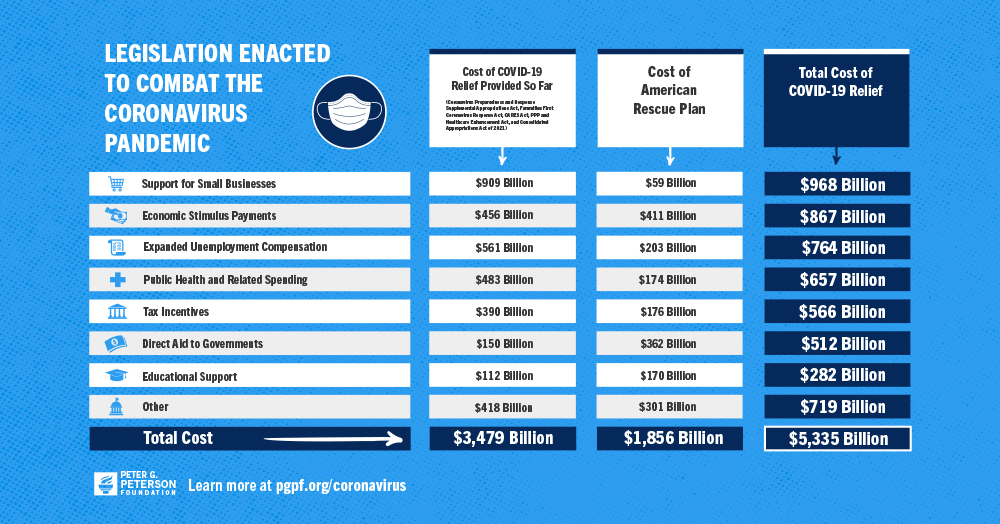
- The government enacted a $1.9 trillion relief package to help the nation recover from the COVID-19 pandemic.
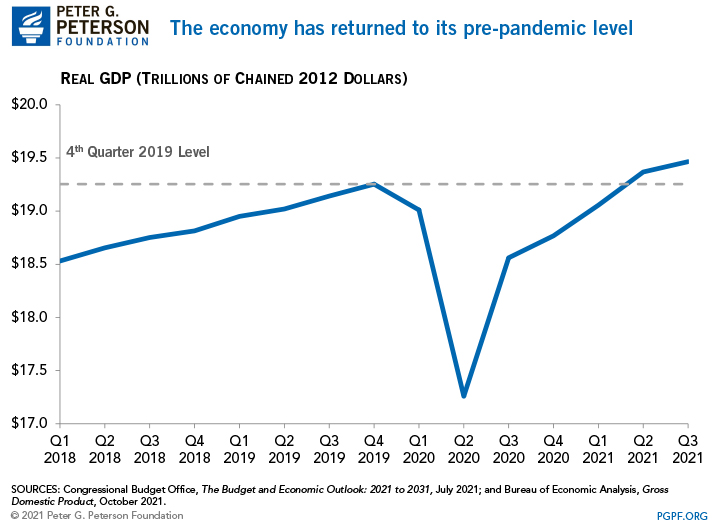
- The U.S. economy rebounded quickly from the recession.
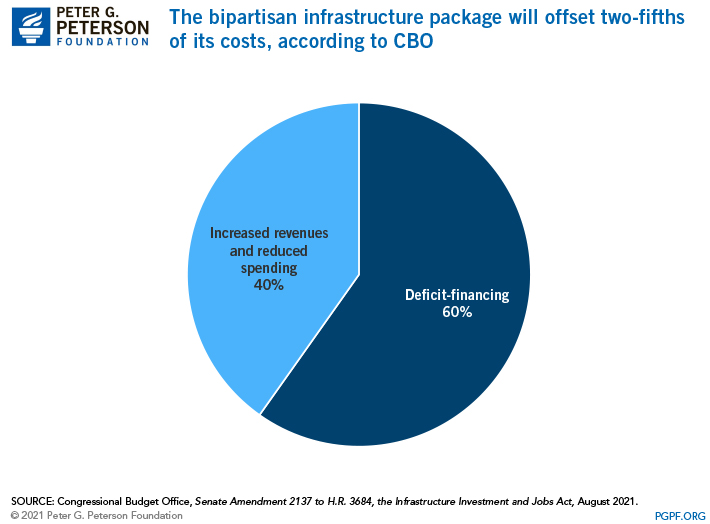
- The Infrastructure Investment and Jobs Act, which was signed into law in November, provides new federal investment in the nation’s infrastructure over the next few years.
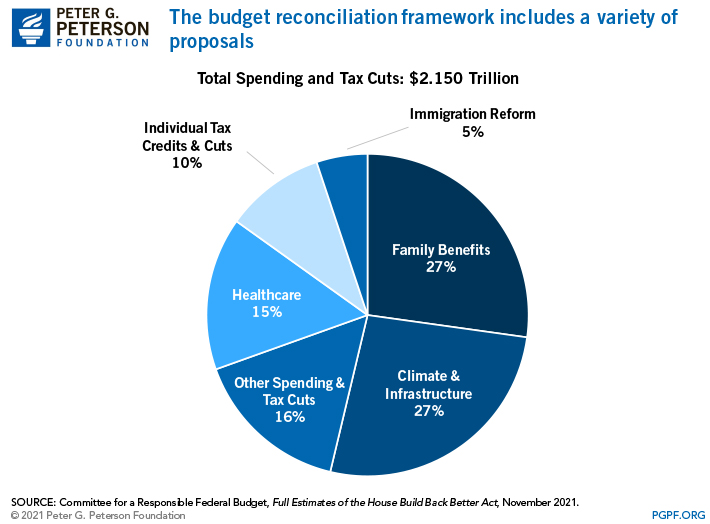
- The Biden Administration proposed the Build Back Better Act, which calls for new spending on various priorities such as child care and climate resilience.
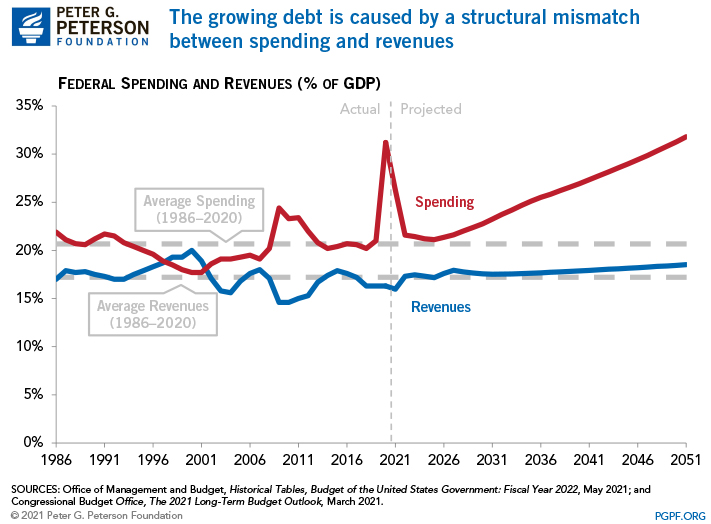
- Revenue growth is projected to lag behind the growth in spending.
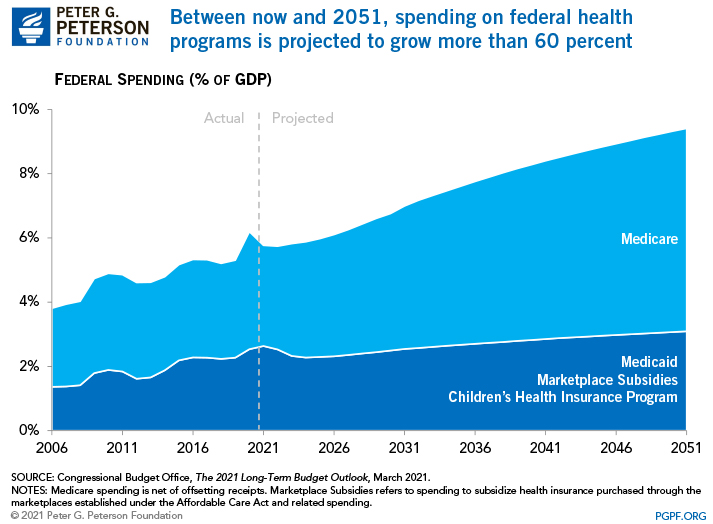
- Healthcare costs are one of largest drivers of the long-term growth in federal spending.
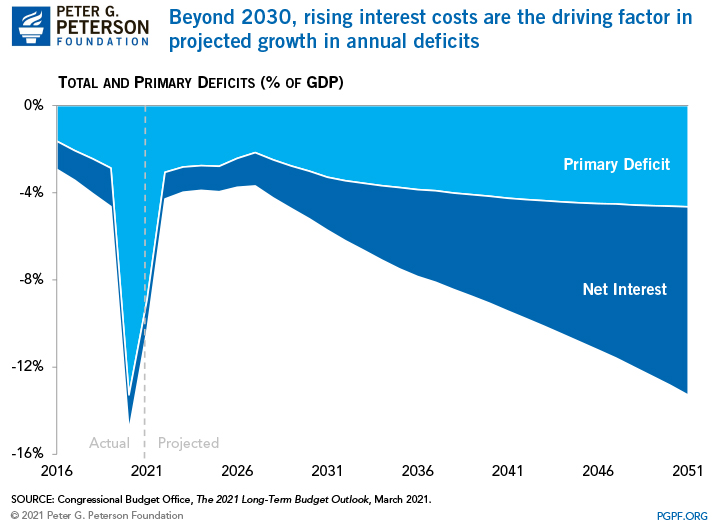
- Interest payments were low in 2021 relative to the size of the economy but are projected to rise sharply throughout the coming years.
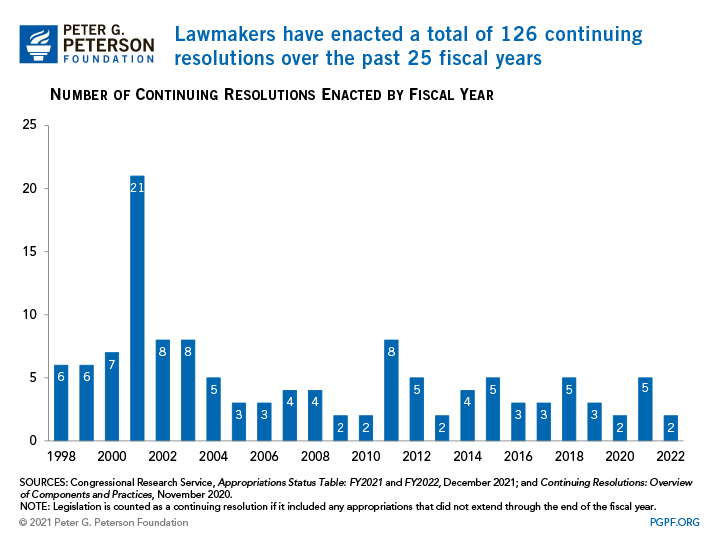
- For 2022, the government had to enact continuing resolutions to prevent a government shutdown.
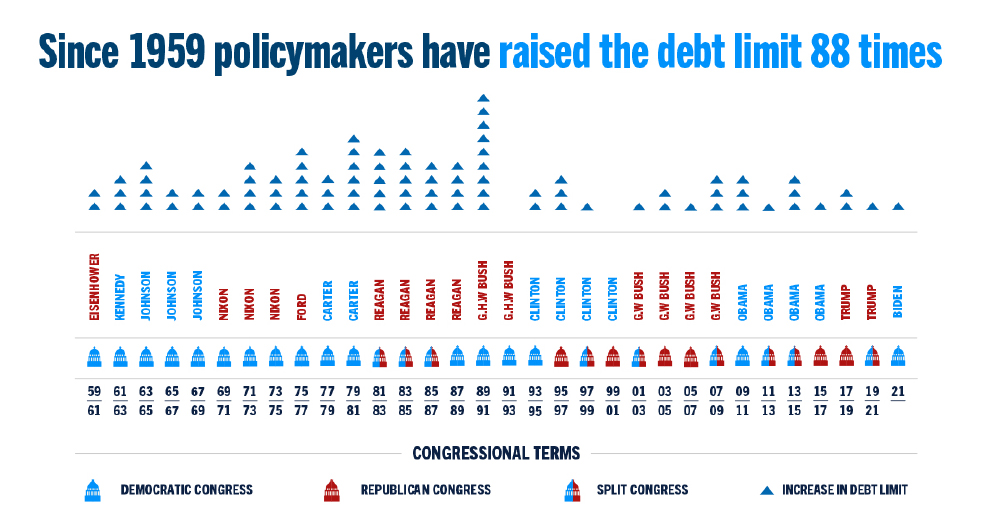
- Lawmakers raised the statutory debt limit to enable the government to borrow money to finance existing obligations.
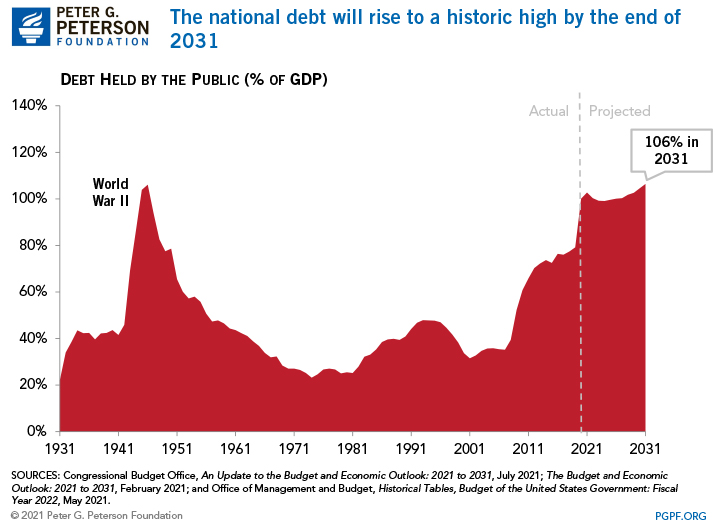
- The national debt remains on an unsustainable path.
That total was surpassed only by the $3.1 trillion deficit recorded for 2020.
Deficits as a percentage of gross domestic product (GDP) equaled 15 percent of GDP in 2020 and 12 percent in 2021.
The federal government spent $6.8 trillion in the past year, which is about $266 billion (or 4 percent) more than the total outlays in 2020. Much of the growth is accounted for by the increased spending on income support authorized by legislation to provide relief from the pandemic.
In fact, revenues grew even faster than spending — by $626 billion (or 18 percent) to $4.0 trillion, largely due to the general strength of the economy and federal support which has led to increases in individual and corporate income tax receipts.
The American Rescue Plan, which was signed into law on March 10, provided relief in various areas such as direct payments to individuals, aid to state and local governments, and expansion of unemployment benefits. In total, the six COVID relief bills enacted by lawmakers in 2020 and 2021 are expected to cost more than $5 trillion.
Although the Delta variant of COVID-19 slowed economic growth over the past several months, GDP is now higher than its pre-pandemic level.
The legislation includes additional funding for transportation infrastructure, such as roads and bridges, as well as other infrastructure areas like broadband and clean water. It also includes various provisions to offset that spending, but an estimate by the Congressional Budget Office (CBO) indicates that those pay-fors will cover only about 40 percent of the total cost.
CBO estimates that the House version of the reconciliation bill, which includes various provisions to offset the increased spending and tax cuts, will add $160 billion to the deficits throughout 2031.
Over the next decade, the structural gap between revenues and spending will continue to grow.
Due to inefficiencies in the U.S. healthcare system as well as the aging population, the federal government’s spending on major healthcare programs like Medicare and Medicaid are projected to grow rapidly from 5.8 percent of GDP in 2021 to 9.4 percent of GDP by 2051.
Within a couple of decades, CBO estimates that interest costs will exceed the size of primary deficits (or the difference between spending and revenues excluding debt service) and become the main driver of growing annual deficits.
Lawmakers have frequently resorted to such short-term solutions throughout history, thereby missing the opportunity to set budget priorities and address long-term fiscal challenges. The current continuing resolution expires on February 18, 2022.
The debt limit was reinstated in August and subsequently was raised by $480 billion to $28.9 trillion, which is expected to cover government activities through mid-December 2021. Increases in the debt limit are necessary to address borrowing that has already been legislated by Congress and the President; holding it hostage introduces uncertainties about the government’s creditworthiness that could cause interest rates to rise and increase the government’s cost of borrowing.
Based on projections made by CBO in July, federal debt is expected to reach its all-time high within a decade.
Related: Interactive Tool: How Much Coronavirus Funding Has Gone to Your State?
Image credit: Photo by Andriy Onufriyenko / Getty Images