
You are here
Revenues
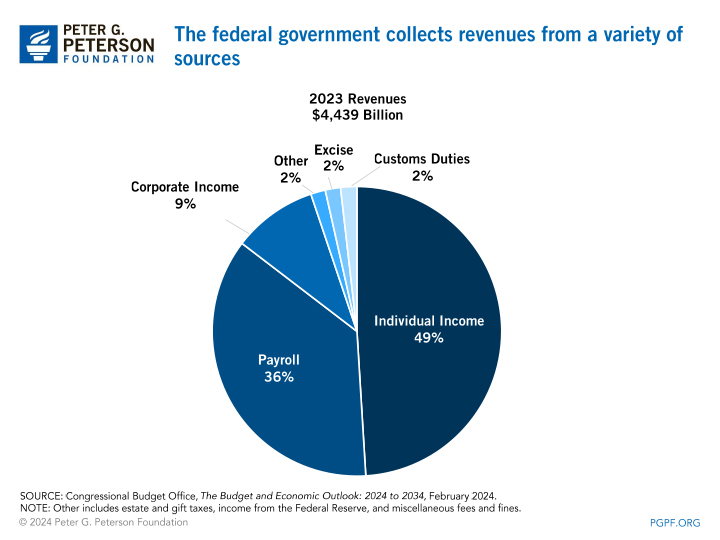
The federal government finances its operations with taxes, fees, and other receipts collected from many different sectors of the economy. In 2023, federal receipts totaled about $4.4 trillion, or 16.5 percent of gross domestic product (GDP). The largest sources of revenues are individual income taxes and payroll taxes followed by corporate income taxes. Absent changes in tax laws, the total amount of revenues generally follows the path of the economy.
Sources of Federal Revenues
- Individual Income Taxes: The federal government collects taxes on the wages and salaries earned by individuals, income from investments (for example, interest, dividends, and capital gains), and other income. Individual income taxes are the largest single source of federal revenues, constituting nearly one-half of all receipts. As a percentage of GDP, individual income taxes have ranged from 6 to 10 percent over the past 50 years, averaging 8 percent of GDP. Total tax liabilities among individuals vary considerably by income. In 2019, the most recent year with available data for tax liabilities, the top quintile of earners paid 90 percent of all individual income taxes, while people in the lowest two income quintiles had negative income tax liabilities (that is, on average, they received more in refundable tax credits than they owed in income taxes).
- Payroll Taxes: Both employers and employees contribute payroll taxes, also known as social insurance taxes. Such taxes are the second-largest component of federal revenues and account for approximately one-third of total federal revenues. Payroll taxes help fund Social Security, Medicare, and unemployment insurance. For Social Security, employers and employees each contribute 6.2 percent of every paycheck, up to a maximum amount ($160,200 in 2023 - the amount is adjusted for average wage growth each year). For Medicare, employers and employees each contribute an additional 1.45 percent with no salary limit. The Affordable Care Act added another 0.9 percent in payroll taxes on earnings over $200,000 for individuals or $250,000 for married filing jointly. Employers also pay the federal unemployment tax, which finances state-run unemployment insurance programs. The 50-year average of total revenues from payroll taxes is approximately 6 percent of GDP.
- Corporate Income Taxes: The government collects taxes on the profits of corporations. For 2023, most corporate income is taxed at 21 percent at the federal level (before adjustments). When combined with state and local corporate taxes, the average statutory tax rate is 25.8 percent, although most corporations pay less than the statutory rate because of exemptions, deductions, and other adjustments to income. Corporate taxes amount to approximately 9.5 percent of all tax revenues, or approximately 1.6 percent of GDP.
- Excise Taxes: Taxes on certain goods such as tobacco, alcohol, and motor fuels also contribute to federal revenues. Those excise taxes are imposed at the point of sale and add to the prices that consumers pay for such goods. Revenues from excise taxes are approximately 0.3 percent of GDP.
- Customs Duties: The government collects revenues from duties and tariffs on imports. Those revenues amount to approximately 1.8 percent of all tax revenues, or 0.3 percent of GDP.
- Other: Federal revenues come from other sources such as estate and gift taxes, which are approximately 0.1 percent of GDP, as well as the deposit of earnings from the Federal Reserve System, among others.
Understanding Who Pays Taxes and How
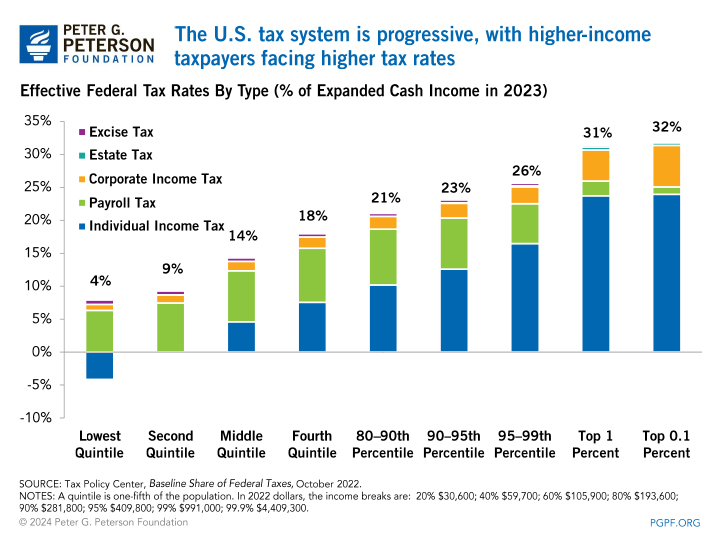
To assess whether the tax system is fair or not, it is important to look at all of the taxes that people pay, not just one particular form of taxation.
For example, while it is true that many people owe little or no individual federal income tax, there are many other kinds of taxes that apply to individuals. In fact, taxpayers whose incomes are in the bottom 80 percent of all incomes pay, on average, more in payroll taxes than in income taxes. At the other end of the spectrum, high-income Americans receive a significant amount of their income from capital gains and dividends, which are taxed at lower rates than wages and salaries. However, wealthier taxpayers also face higher tax rates on their other income and indirectly bear a greater share of the corporate income tax, which significantly raises their overall effective tax rates.
On aggregate, our federal tax system is structured to be generally progressive, with higher-income taxpayers paying a larger share of their income in taxes. However, the composition of taxes paid is very different for taxpayers at different ends of the income distribution. For low-income Americans, payroll taxes and excise taxes are the major forms of taxation; for high-income Americans, individual and corporate income taxes comprise most of their tax burden.
Tax Expenditures
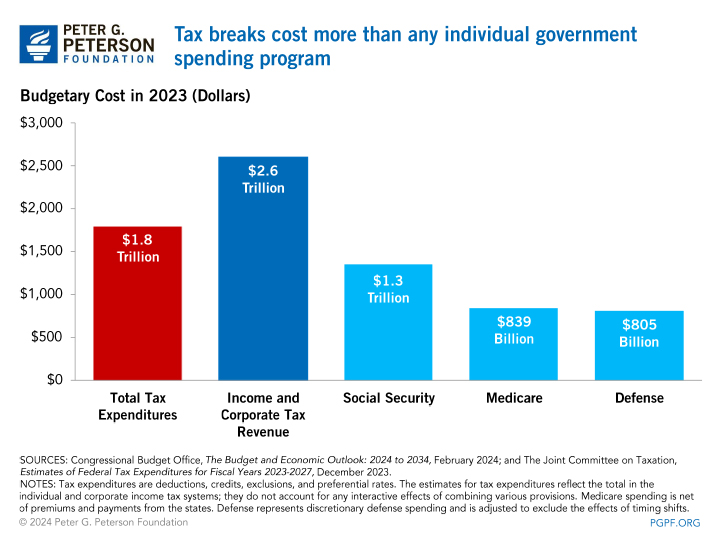
The income tax code also contains provisions that allow individual and corporate taxpayers to reduce their tax bills. Such special provisions — deductions, exemptions, deferrals, exclusions, credits, and preferential rates — are known as tax expenditures. In 2023, tax expenditures totaled approximately $1.8 trillion. That amount equals nearly 70 percent of the revenues that the federal government actually collected in income taxes and exceeds what was spent by any single agency or spending program, including Social Security and the Department of Defense.
Tax expenditures work in various ways and take many forms, including:
- Tax deductions, which are expenses that can be subtracted from gross income to reduce actual taxable income. The interest paid on home mortgages (subject to certain limitations), for example, can be deducted from gross income.
- Preferential rates that apply to certain types of income, such as capital gains and dividends.
- Tax credits, which are subtracted from a taxpayer’s total tax liability. For example, businesses can claim a tax credit for making investments in hybrid solar lighting systems.
- Exclusions that reduce the amount of total income subject to taxation. The single largest tax expenditure is the exclusion from taxable income of payments for health insurance made by employers on behalf of their employees.
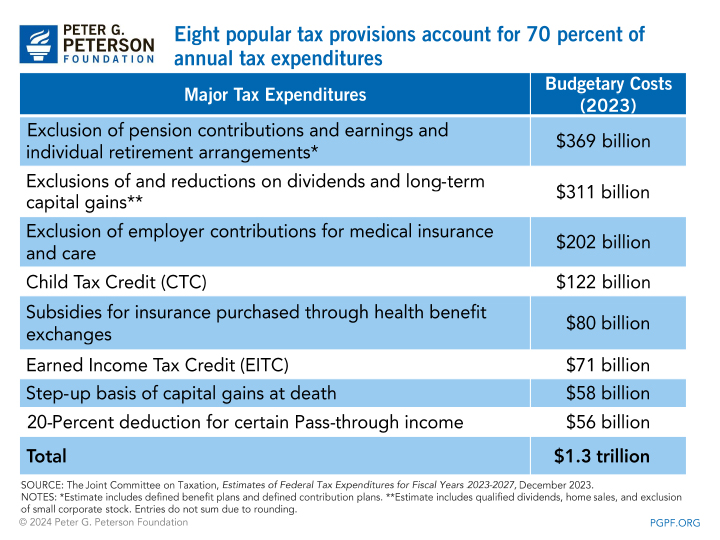
Just eight tax expenditures amounted to $1.3 trillion in 2023 — over half the cost of all such expenditures combined.
Tax expenditures are often referred to as "spending in disguise," because lawmakers use the tax code to direct subsidies to specific constituencies and activities. Policymakers also use tax expenditures to influence consumer and business behavior. The mortgage-interest deduction, for example, encourages taxpayers to buy homes instead of renting. Similarly, depreciation provisions for businesses encourage new purchases of equipment. In addition, because tax expenditures subsidize "favored" activities, they can distort economic decisions in ways that reduce the productivity of our economy.
Tax expenditures generally receive less scrutiny than spending programs. Most do not need annual review and approval, and therefore often remain in place for many years. With few opportunities for review and consideration, they are harder to control and less transparent than line-item spending programs. Many tax expenditures are also more valuable for people at higher marginal tax rates, so the benefits of tax expenditures often skew toward those with higher incomes.