
You are here
What Types of Securities Does the Treasury Issue?

CBO expects total federal borrowing from the public to reach $25.8 trillion in 2023, the highest amount ever recorded. That figure represents the net amount that the United States Treasury has borrowed from creditors by issuing securities that raise cash to support government activities. Debt held by the public does not include intragovernmental debt, which, in simple terms, is debt that the government owns itself. As the United States continues to borrow a significant amount of money each year, let’s take a closer look at a few key characteristics of Treasury borrowing that can affect its budgetary cost, including the different types of Treasury securities issued to the public as well as trends in interest rates and maturity terms.
Types of Treasury Securities
The U.S. Treasury offers marketable and nonmarketable securities. Marketable securities are sold at auction in various maturities and traded on secondary markets. Such securities represented 98 percent of all debt held by the public as of June 2023. Nonmarketable securities are issued directly to buyers (rather than auctioned) and are not traded in secondary markets; that type of issuance made up just 2 percent of total debt held by the public at the end of June 2023.
Marketable Treasury securities are issued in various forms:
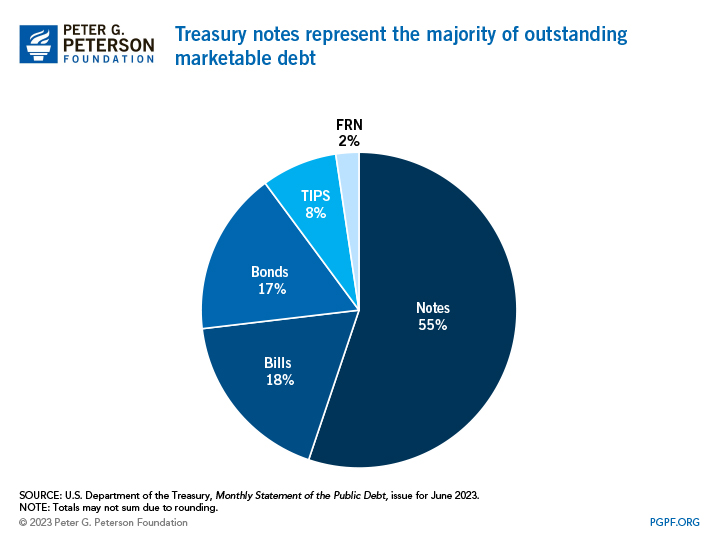
- Treasury Bills have a maturity of one year or less. Such short-term securities are issued at a discount and the face value is paid upon maturity. Bills represented about 18 percent of all outstanding marketable Treasury debt at the end of June 2023.
- Treasury Notes have maturities ranging from two to 10 years. Notes are coupon securities, which means that the semiannual interest payments are set at the time of issuance and purchasers collect the principal at maturity. Notes are the single largest category of Treasury securities, representing about 55 percent of all marketable debt at the close of June 2023.
- Treasury Bonds maturities of more than 10 years. Bonds are also coupon securities and represented about 17 percent of all marketable debt at the end of June 2023.
- Treasury Inflation-Protected Securities, or TIPS, have maturities of 5, 10, and 30 years. The principal amount on TIPS are adjusted semiannually to account for inflation; interest is paid every six months on the adjusted principal. TIPS represented roughly 8 percent of all marketable debt at the end of June 2023.
- Floating-Rate Notes (FRNs) have a maturity of two years and a rate of interest that is adjusted each quarter; the rate is based on the prevailing interest rate for 13-week Treasury bills. Introduced in 2014, FRNs represented 2 percent of total marketable debt at the end of June 2023.
While Treasury notes account for the majority of outstanding securities, the share of marketable debt represented by such securities has declined over the years — from 67 percent in 2011 to 55 percent today. That share has declined due to the increased issuance of other securities such as bonds and bills in response to the federal government’s borrowing needs. For example, bills represented 15 percent of total marketable debt at the end of 2011, but borrowing to address the pandemic boosted that share to 24 percent, reflecting the comparative ease with which the Treasury can raise cash quickly by issuing bills. Today, bills represent 18 percent of marketable debt as pandemic-related borrowing has stopped.
Average Interest Rate on Treasury Securities
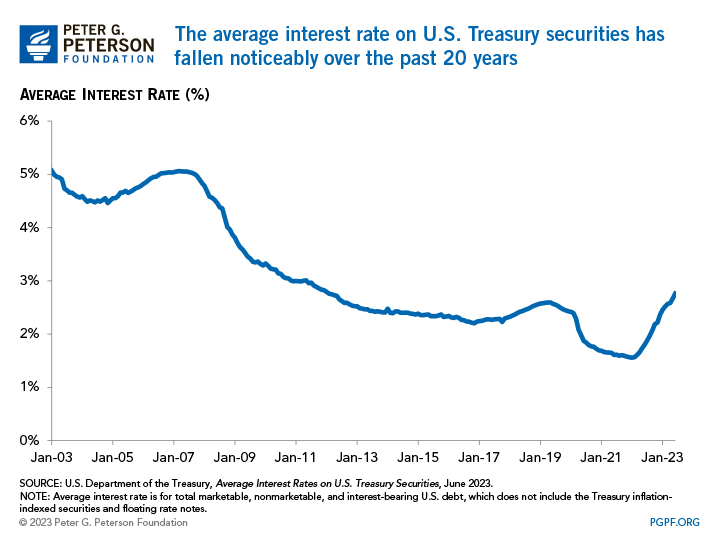
Treasury data show that the average interest rate on all U.S. interest-bearing debt declined from 5.1 percent in January of 2003 to 1.6 percent near the end of 2021. The average interest rate began to fall at the onset of the 2008 financial crisis and remained low throughout the recovery, reaching 2.2 percent in November 2016. At the end of 2019, before the pandemic hit, the average interest rate had only crept up to 2.4 percent. While the rate briefly declined during the COVID-19 pandemic, it has since increased to 2.8 percent as of June 2023.
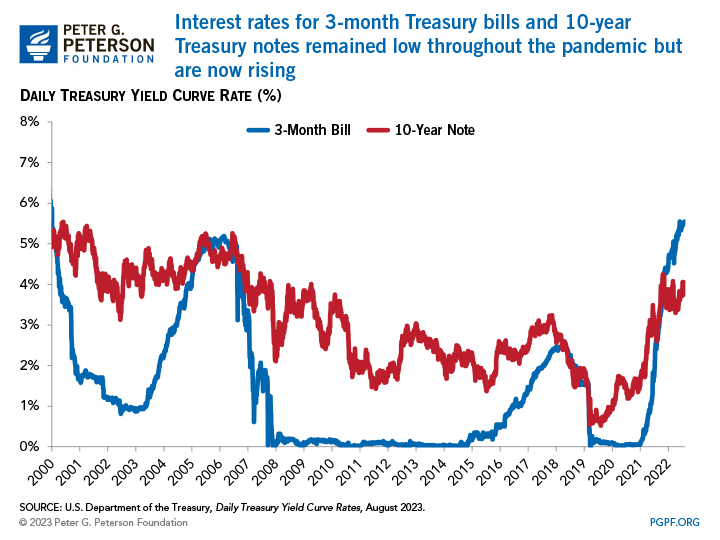
The daily interest rates for both 3-month Treasury bills and 10-year Treasury notes experienced notable fluctuations between July 2003 and July 2023. In July 2003, the daily yield on Treasury bills was 1.0 percent and the yield on notes was 4.4 percent because of demand for safe investments in light of the 2001 recession. As the economy recovered and investor confidence in the economy grew between 2003 and 2007, the demand for Treasury securities lessened and thus the yields on bills and notes both rose to around 5 percent. Then, by the late fall of 2008 when the Great Recession was at its worst, bill yields plummeted to a low of 0.01 percent, and remained below 1 percent until the middle of 2017. Meanwhile, the yield on notes fell to around 2.0 percent in late 2008, and averaged 2.5 percent over the next 10 years. Following a 5-year peak of 2.5 percent in early 2019, the yield on Treasury bills at the end of 2020 had fallen to just 0.09 percent as the economic fallout associated with the COVID-19 pandemic persisted. Note yields, on the other hand, had reached a 5-year peak of 3.2 percent in late 2018 before dropping to just 0.9 percent at the end of 2020. Those rates increased in the following years as the Federal Reserve undertook monetary policy actions to battle high levels of inflation; as of July 2023, note yields were 4.1 percent and bills 5.5 percent.
Average Maturity of Treasury Securities
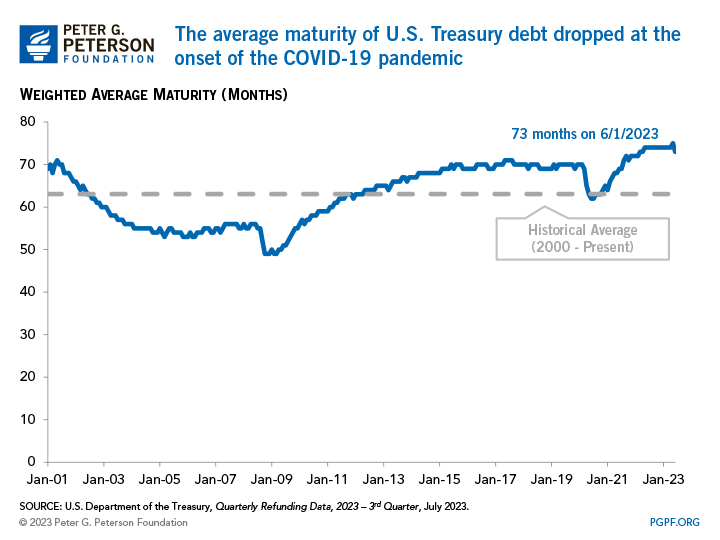
The average weighted maturity of all marketable debt dropped to just four years at the height of the Great Recession in December 2008 as the Treasury issued significantly more short-term securities in order to raise cash quickly to combat the economic fallout. With interest rates at low levels over the last few years, the Treasury took advantage of the opportunity to lengthen the average maturity of its debt and lock in low rates for a longer period. However, the average maturity dropped from 70 months in February 2020 to 62 months in July 2020 as the Treasury ramped up short-term borrowing quickly to address the effects of the COVID-19 pandemic. More recently, average maturity has risen to the highest duration over the last 20 years, reaching 75 months in May 2023, as some of the short-term borrowing was replaced by longer-term maturities. The share of total outstanding marketable Treasury securities represented by bills declined from 25 percent in July 2020 to 18 percent in June 2023, while the share represented by notes increased from 52 percent to 55 percent. The current average maturity of 73 months is 10 months longer than the 20-year historical average.
Related: Here’s Everything the Federal Government Has Done to Respond to the Coronavirus So Far
Image credit: Photo by Hisham Ibrahim / Getty Images