
You are here
Peter G. Peterson Foundation Third Monthly "Fiscal Confidence Index" Finds Continued High Levels of Concern about America's Long-Term Debt and Significant Support for Replacing Sequester
Contact: Sarah Stipicevic, Press Secretary
(212) 542-9265 sstipicevic@pgpf.org
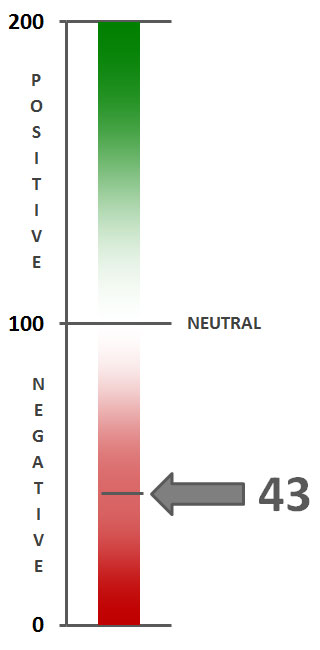
February 2013 Fiscal Confidence Index, Modeled after the Consumer Confidence Index, is 43 (100 is Neutral), Indicating Strongly Negative Public Sentiment
75% of Americans Want Congress and the President to Replace Sequester, Only 12% Want Sequester to Go Into Effect March 1st
76% of Respondents Want Washington to Agree on a Long-Term Debt Plan Now to Help Improve the Economy
NEW YORK — Americans continue to be concerned about the nation's long-term debt and believe the problem is likely to get worse in the next few years, according to the Peter G. Peterson Foundation’s latest Fiscal Confidence Index, a monthly measure of public attitudes about the nation's long-term debt and the efforts elected leaders are making to address the debt.
The February 2013 Fiscal Confidence Index, modeled after the Consumer Confidence Index, is 43 (100 is neutral), indicating strongly negative public sentiment about America’s fiscal situation. Sentiment is largely unchanged from January's reading of 40, and remains below December's reading of 52.
The Fiscal Confidence Index measures public opinion about the national debt by asking six questions in three key areas:
- CONCERN: Level of concern and views about the direction of the national debt.
- PRIORITY: How high a priority addressing the debt should be for elected leaders.
- EXPECTATIONS: Expectations about whether the debt situation will get better or worse in the next few years.
The survey results from these three areas are weighted equally and averaged to produce the Fiscal Confidence Index value. The Fiscal Confidence Index, like the Consumer Confidence Index, is indexed on a scale of 0 to 200, with a neutral midpoint of 100. A reading above 100 indicates positive sentiment. A reading below 100 indicates negative sentiment.
"The February 2013 Fiscal Confidence Index shows that Americans remain very concerned about our long-term fiscal challenges and want Washington to agree on solutions," said Michael A. Peterson, President and COO of the Peterson Foundation. "Most Americans agree that it would help our economy to put in place a long-term plan to reduce debt levels. Americans clearly favor taking action to replace the sequester and would prefer to see a comprehensive long-term deficit reduction plan instead of automatic across-the-board cuts."
Fiscal Confidence Index Key Data Points:
- The February 2013 Fiscal Confidence Index value is 43. A score of 100 is neutral. Values below 100 show negative sentiment, while values above 100 show positive sentiment. (January's value was 40. December's value was 52.)
- The current Fiscal Confidence Index score for CONCERN about the debt is 38, indicating strong concern about the debt. The score for debt as a PRIORITY that leaders must address is 15, indicating that Americans want elected leaders to make addressing long-term debt a high priority. The score for EXPECTATIONS about progress on the debt over the next few years is 76, indicating pessimism about the direction of long-term debt in the next few years. The Fiscal Confidence Index of 43 is the average of these three sub-category scores.
- The Fiscal Confidence Index and sub-category scores are largely unchanged since January, reflecting the lack of progress by legislators in Washington around the sequester, and the temporary suspension of the debt ceiling debate.
- For a description of the complete methodology, see the Appendix below.
Americans Want Lawmakers to Take Action on Long-Term Debt
The Peterson Foundation also asked whether lawmakers should agree on a long-term debt reduction plan now or wait until economic growth improves.
- 76% of respondents said lawmakers should agree on a long-term deficit reduction plan now that can be implemented gradually as the economy recovers — 57% feel that way "strongly." Only 18% favor waiting to agree on a long-term plan until the economy is stronger.
Americans Strongly Favor Sequester Replacement
As the nation approaches the March 1st deadline for sequestration to go into effect, the Peterson Foundation polled Americans on their views about sequestration and options for replacing it.
- Only 12% of Americans said the sequester should go into effect as currently planned. 75% prefer that Congress and the President replace the sequester with an alternative deficit reduction plan.
- Americans prefer a plan of alternative cuts without tax increases (46%) to a plan that includes both spending cuts combined with tax increases (29%).
- Feelings about sequester alternatives are driven largely by political affiliation: Republicans (56% cuts with no tax increases, 14% cuts with tax increases) support a deficit reduction plan with alternative cuts only, while a plurality of Democrats (37% cuts with no tax increases, 44% cuts with tax increases) backs a plan that includes both spending cuts and tax increases.
The Peter G. Peterson Foundation commissioned the poll by the Global Strategy Group to survey public opinion on the national debt. The nationwide poll included 1,003 U.S. registered voters, surveyed by telephone between February 19 and February 21, 2013. The poll has a margin of error of +/- 3.1%. The poll examined voters’ opinions on the national debt, political leadership, and America’s fiscal and economic health.
Detailed poll results can be found online at: www.pgpf.org/what-we-are-doing/education-and-awareness/fiscal-confidence-index
About the Peter G. Peterson Foundation
The Peter G. Peterson Foundation is a nonprofit, nonpartisan organization established by Pete Peterson — businessman, philanthropist, and former U.S. Secretary of Commerce. The Foundation is dedicated to increasing public awareness of the nature and urgency of key long-term fiscal challenges threatening America's future and to accelerating action on them. To address these challenges successfully, we work to bring Americans together to find and implement sensible, long-term solutions that transcend age, party lines and ideological divides in order to achieve real results. To learn more, please visit www.PGPF.org.
APPENDIX: Fiscal Confidence Index Methodology and Questions
- The Fiscal Confidence Index will be released monthly by the Peter G. Peterson Foundation.
- The Fiscal Confidence Index value is based on six questions in three categories.
- As is done with the Consumer Confidence Index, the first step in calculating the Fiscal Confidence Index is determining the "Relative Value" for each question. This calculation is made by taking the positive response for each question and dividing it by the sum of the positive and negative responses. Each question was asked on a four-point scale, and answers were weighted according to intensity, with the strongest responses counting twice as much as the middle responses ("much" better or worse answers count twice as heavily as "somewhat" better or worse answers).
- The scores for the Concern, Priority, and Expectations categories are determined by averaging the scores derived from the two questions in each category.
- The Fiscal Confidence Index value is converted from the Relative Value to place it on a scale on which 100 indicates equal positive and negative sentiment, while values below 100 indicate negative sentiment and values above 100 indicate positive sentiment.
- The Peter G. Peterson Foundation commissioned a poll by the Global Strategy Group to survey public opinion on the national debt. The nationwide poll included 1,003 U.S. registered voters, surveyed by telephone between February 19 and February 21, 2013. The poll has a margin of error of +/- 3.1%. The poll examined voters’ opinions on the national debt, political leadership, and America’s fiscal and economic health.
- The questions are as follows:
| CONCERN (38) | ||||
|---|---|---|---|---|
|
Thinking about our national debt over the last few years, would you say your level of concern has increased or decreased? ◊ Is that a lot or just a little? |
Feb. 2013 | Jan. 2013 | Dec. 2012 | |
| Increased a lot | 52% | 60% | 51% | |
| Increased a little | 24% | 21% | 25% | |
| Decreased a little | 7% | 4% | 7% | |
| Decreased a lot | 3% | 2% | 3% | |
| (No change) | 13% | 12% | 12% | |
| (Don't Know/Refused) | 1% | 1% | 2% | |
| INCREASED (NET) | 76% | 81% | 77% | |
| DECREASED (NET) | 10% | 7% | 10% | |
|
When it comes to addressing our national debt, would you say things in the United States are heading in the right direction or do you think things are off on the wrong track? ◊ Do you feel that way strongly or just somewhat? |
Feb. 2013 | Jan. 2013 | Dec. 2012 | |
| Right direction-Strongly | 11% | 9% | 17% | |
| Right direction-Somewhat | 20% | 19% | 23% | |
| Wrong track-Somewhat | 17% | 17% | 14% | |
| Wrong track-Strongly | 42% | 44% | 36% | |
| (Neither/Mixed) | 6% | 7% | 5% | |
| (Don't Know/Refused) | 5% | 5% | 5% | |
| RIGHT DIRECTION (NET) | 30% | 28% | 39% | |
| WRONG TRACK (NET) | 59% | 60% | 51% | |
| PRIORITY (15) | ||||
|---|---|---|---|---|
|
Some people say that addressing the national debt should be among the President and Congress' top 3 priorities. Do you agree or disagree? ◊ Do you feel that way strongly or just somewhat? |
Feb. 2013 | Jan. 2013 | Dec. 2012 | |
| Strongly agree | 66% | 71% | 71% | |
| Somewhat agree | 21% | 18% | 18% | |
| Somewhat disagree | 5% | 4% | 4% | |
| Strongly disagree | 4% | 3% | 4% | |
| (Don't Know/Refused) | 4% | 3% | 4% | |
| AGREE (NET) | 87% | 89% | 89% | |
| DISAGREE (NET) | 9% | 7% | 7% | |
|
And when it comes to our national debt, do you think it is an issue that the President and Congress should spend more time addressing or less time addressing? ◊ Would you say a lot (more or less) time or just a little? |
Feb. 2013 | Jan. 2013 | Dec. 2012 | |
| A lot more time | 62% | 68% | 66% | |
| A little more time | 22% | 19% | 20% | |
| A little less time | 6% | 4% | 5% | |
| A lot less time | 3% | 3% | 1% | |
| (The same amount of time) | 4% | 3% | 4% | |
| (Don't Know/Refused) | 3% | 3% | 3% | |
| MORE TIME (NET) | 84% | 87% | 87% | |
| LESS TIME (NET) | 8% | 7% | 7% | |
| EXPECTATIONS (76) | ||||
|---|---|---|---|---|
|
And thinking about our national debt over the next few years, do you expect the problem to get better or worse? ◊ Is that much (better or worse) or just somewhat (better or worse)? |
Feb. 2013 | Jan. 2013 | Dec. 2012 | |
| Much better | 11% | 9% | 14% | |
| Somewhat better | 20% | 21% | 30% | |
| Somewhat worse | 25% | 21% | 16% | |
| Much worse | 37% | 40% | 31% | |
| (No change) | 2% | 4% | 2% | |
| (Don't know/Refused) | 5% | 5% | 6% | |
| BETTER (NET) | 31% | 31% | 44% | |
| WORSE (NET) | 62% | 61% | 47% | |
|
And when it comes to our national debt, are you optimistic or pessimistic that the United States will be able to make progress on our national debt over the next few years? ◊ Would you say you are very (optimistic or pessimistic) or just somewhat? |
Feb. 2013 | Jan. 2013 | Dec. 2012 | |
| Very optimistic | 18% | 19% | 23% | |
| Somewhat optimistic | 32% | 29% | 32% | |
| Somewhat pessimistic | 16% | 18% | 13% | |
| Very pessimistic | 30% | 30% | 26% | |
| (Neither/Mixed) | 2% | 3% | 2% | |
| (Don't Know/Refused) | 3% | 2% | 3% | |
| OPTIMISTIC (NET) | 49% | 48% | 55% | |
| PESSIMISTIC (NET) | 46% | 47% | 40% | |