
You are here
Top 7 Fiscal Charts from 2016
A key part of our nonpartisan mission at the Peterson Foundation is to help explain and illustrate the nature of the country’s fiscal challenges. One of our favorite ways to do so is through charts — and these are the most popular charts that people viewed and shared throughout 2016. If you’d like to browse more, check out our Chart Archive.
1) U.S. Defense Spending Compared to Other Countries 
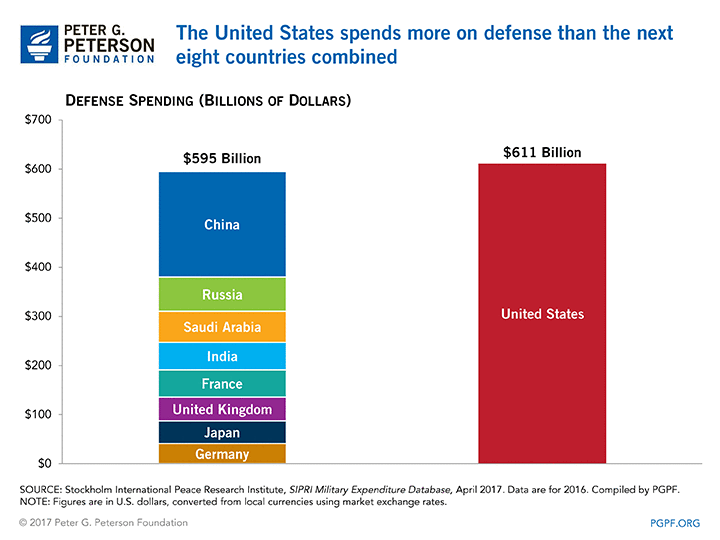
The United States spends far more on defense than any other country in the world. In fact, it spends more than the next seven countries combined. This year, the Coalition for Fiscal and National Security released a new statement emphasizing the fundamental link between America’s long-term fiscal health and our national security. The Coalition, chaired by Admiral Mike Mullen, is comprised of a bipartisan group of highly distinguished and respected leaders in defense, economic, and national security policy. Read the 2016 statement from CFNS.
2) Per Capita Healthcare Costs — International Comparison
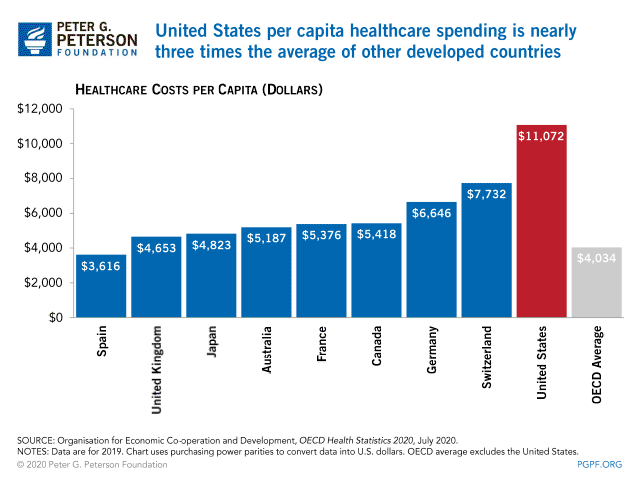
Rising healthcare costs, along with demographic changes, is one of the main drivers of the nation’s fiscal imbalance. At a total spend of approximately $3.4 trillion, or approximately 18% of the national economy, the United States healthcare system is the most expensive among advanced nations. Healthcare experts have estimated that 30% of our total healthcare spending goes to unnecessary, ineffective, inefficient, overpriced and wasteful services. And they are projected to keep rising — faster than inflation, wages, or the overall economy.
3) Effective Federal Tax Rates
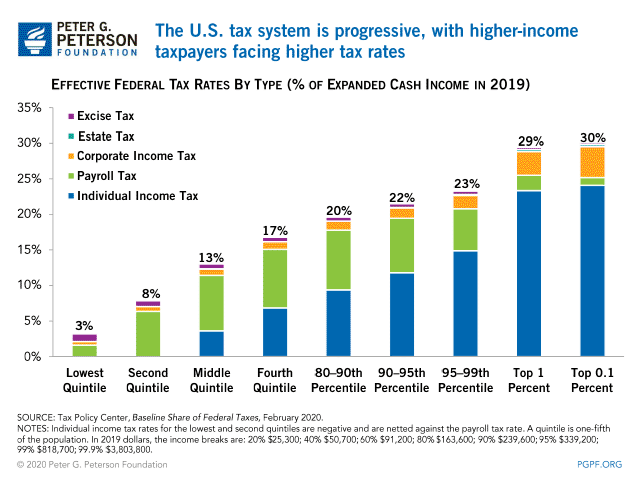
There are two common misconceptions about the U.S. tax code. The first is that low-income people do not pay any taxes. Although they do not pay income taxes on average, they do pay payroll taxes and excise taxes on goods such as gasoline. The second misconception is that that high-income Americans pay less in taxes because they benefit disproportionately from various tax breaks, otherwise known as tax expenditures. On average, the U.S. tax code is progressive — with higher-income taxpayers paying a larger share of their income in taxes — even after tax breaks have been taken into account.
4) International Rankings — Health Outcomes
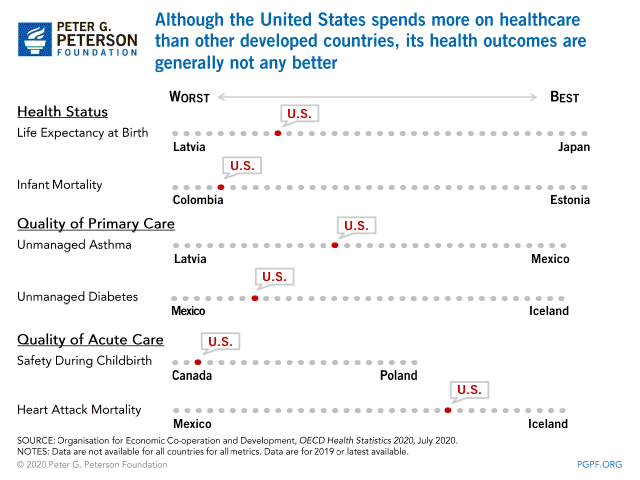
Although the U.S. healthcare system is the most expensive among advanced countries, America’s health outcomes are generally no better than those of our peers, and in some cases are worse, including in areas like unmanaged asthma, diabetes, infant mortality, and life expectancy. Put simply, we are paying more than other countries, but we aren’t seeing better results.
5) Discretionary Spending Breakdown

Government spending is divided into two large categories — mandatory spending (major programs such Social Security, Medicare, and Medicaid whose spending is determined by benefit and eligibility rules) and discretionary (which is determined through the annual appropriations process). Defense spending is the largest single category of discretionary spending and accounts for about 16 percent of all federal spending.
6) Who Benefits from Tax Expenditures?
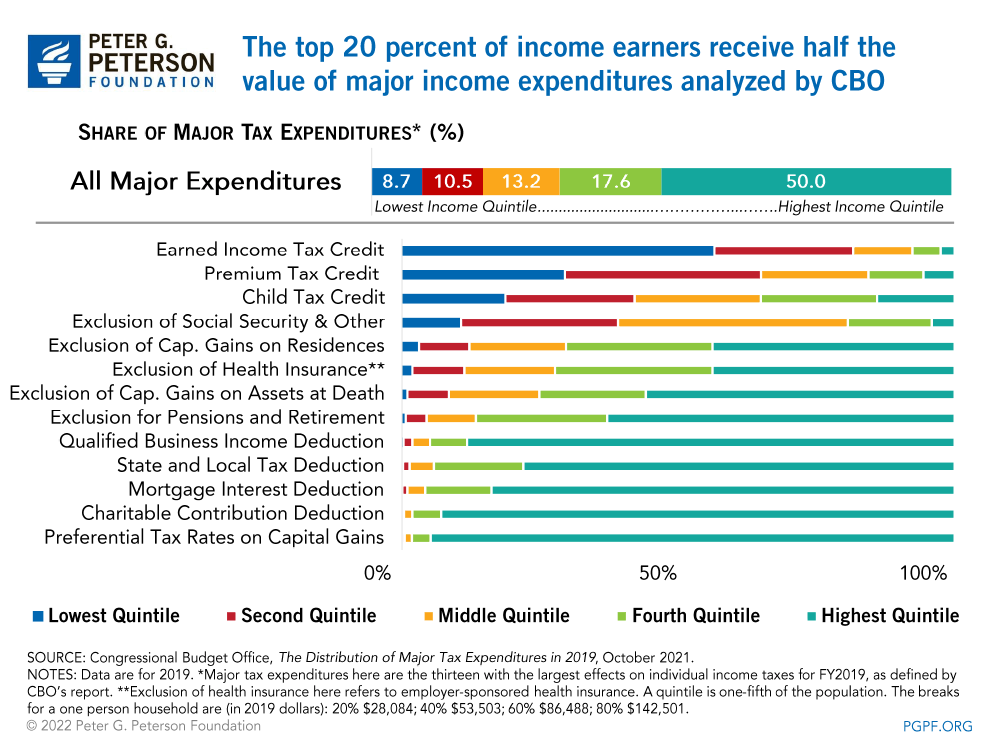
Major tax expenditures (or tax breaks) tend to benefit high-income taxpayers more than lower income groups. Eliminating individual tax expenditures could allow for a number of other changes to the tax system, including lower tax rates, while also producing additional revenues to help reduce our long-term debt. It could also improve the efficiency of our economy and improve taxpayers’ confidence in the fairness of the overall system. Read more about how tax reform could help make the system more equitable and promote growth.
7) Worker-to-Beneficiary Ratio in the Social Security Program
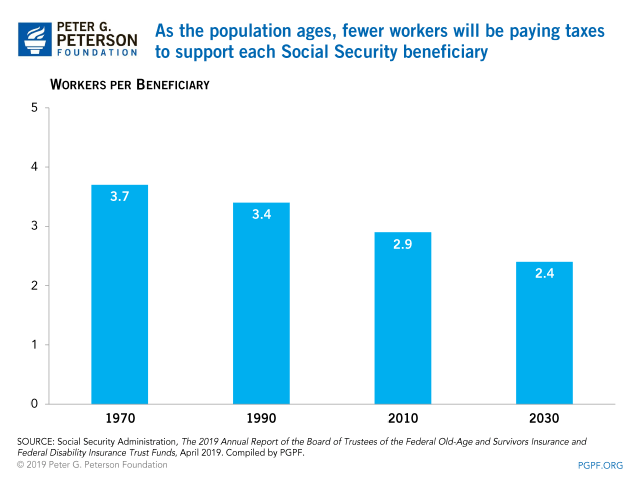
With the retirement of the baby boomers and lengthening life expectancies, programs critical to older Americans will come under significant strain in coming decades. Almost every American worker pays a dedicated payroll tax, which entitles them to benefits when they retire or become disabled. But as the population ages, fewer workers will be paying taxes to support each Social Security beneficiary, endangering the program’s finances. Social Security's trustees project that the program’s trust fund will be depleted in 2034. At that point, 88 million Social Security beneficiaries could face across-the-board benefit cuts of 21 percent if policymakers fail to act.