Charts
May 24, 2023
Drivers of spending growth
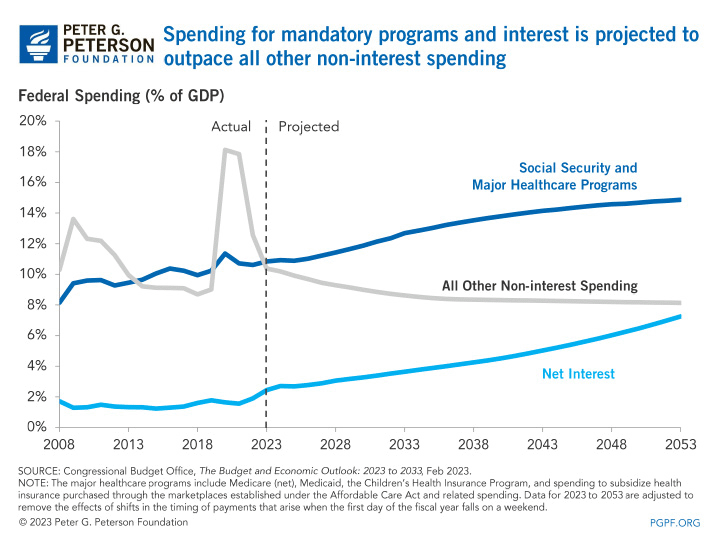
Spending for mandatory programs and net interest is projected to putpace all other non-interest spending.
https://www.pgpf.org/chart-archive/0174_SS_major_health_climb

The search found 146 results in 0.228 seconds.
Spending for mandatory programs and net interest is projected to putpace all other non-interest spending.
https://www.pgpf.org/chart-archive/0174_SS_major_health_climb
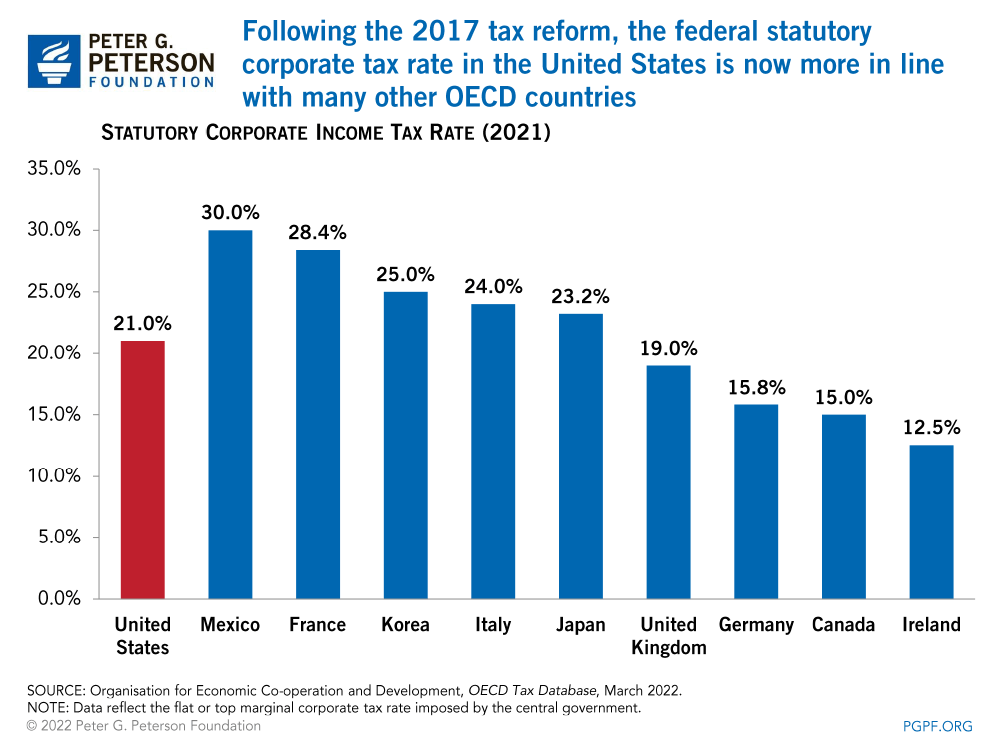
Following the 2017 tax reform, the federal statutory corporate tax rate in the United States is now more in line with many other OECD countries.
https://www.pgpf.org/chart-archive/0273_statutory_corporate_income_tax_rates
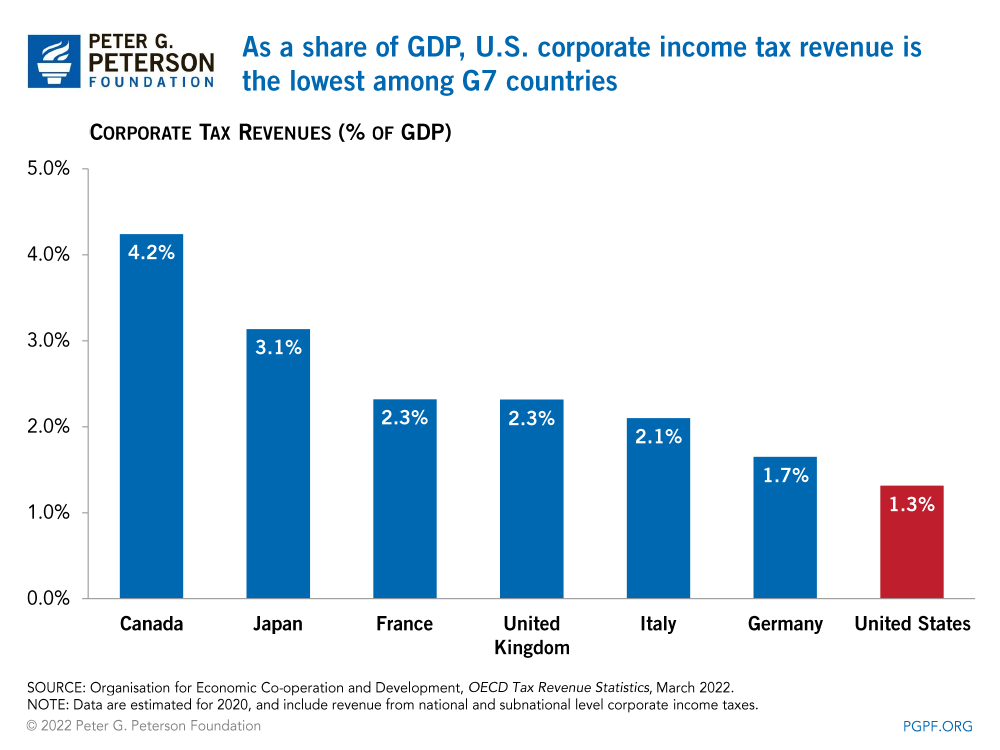
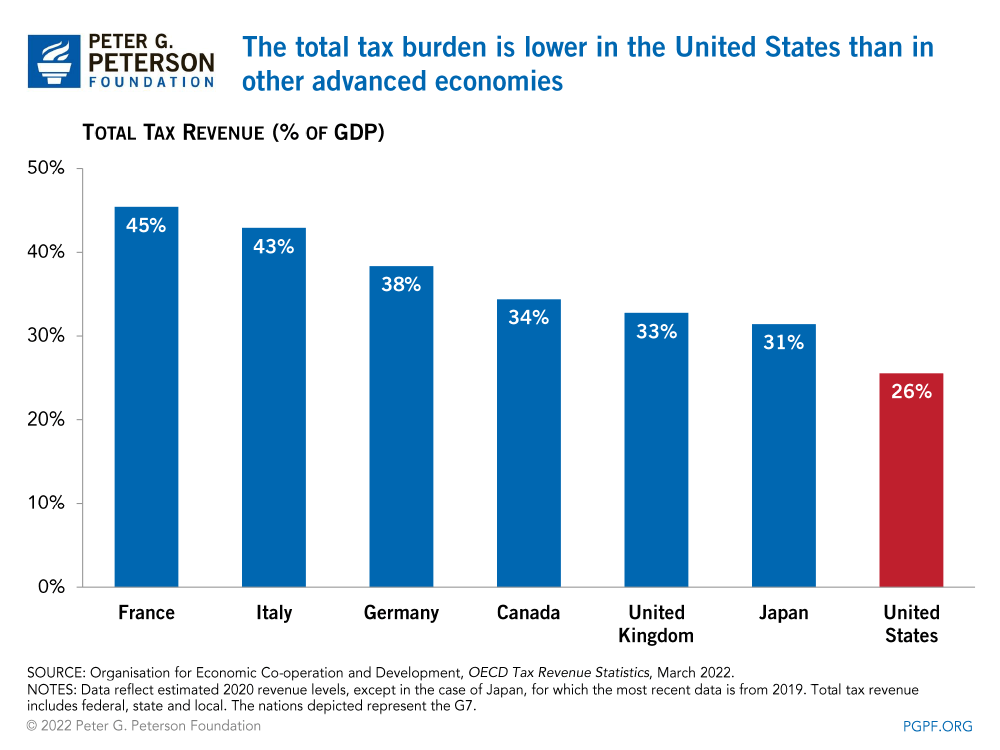
As a share of GDP, the U.S. corporate income tax revenue is the lowest among G7 countries.
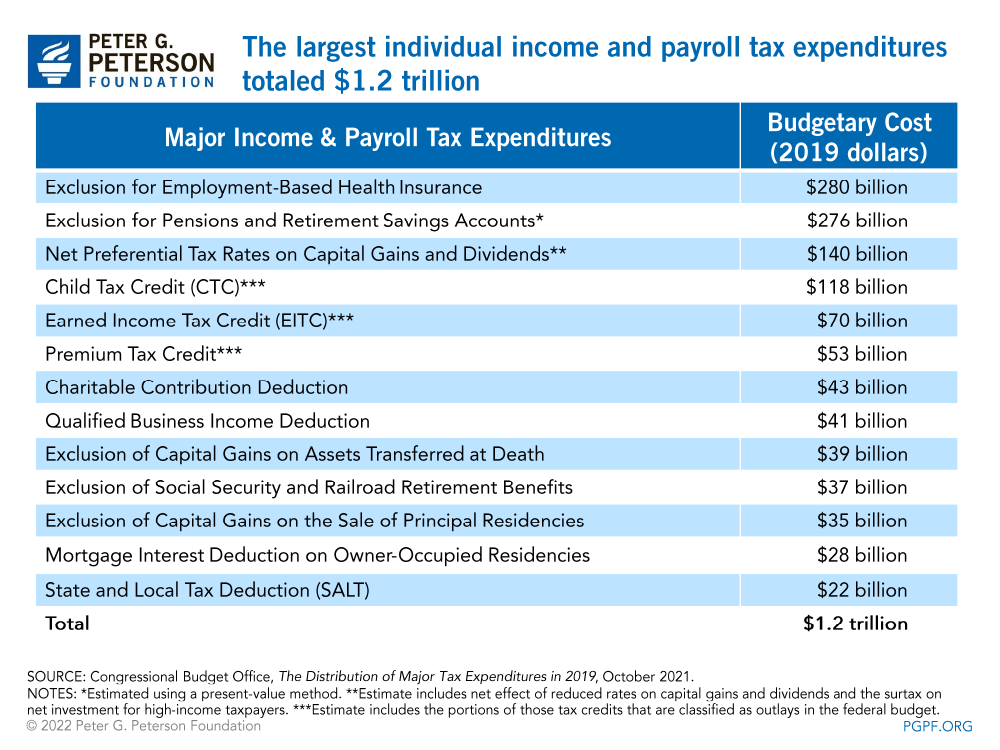
Eight popular tax provisions accounted for a large majority of annual tax expenditures.
https://www.pgpf.org/chart-archive/0009_largest-tax-expenditures
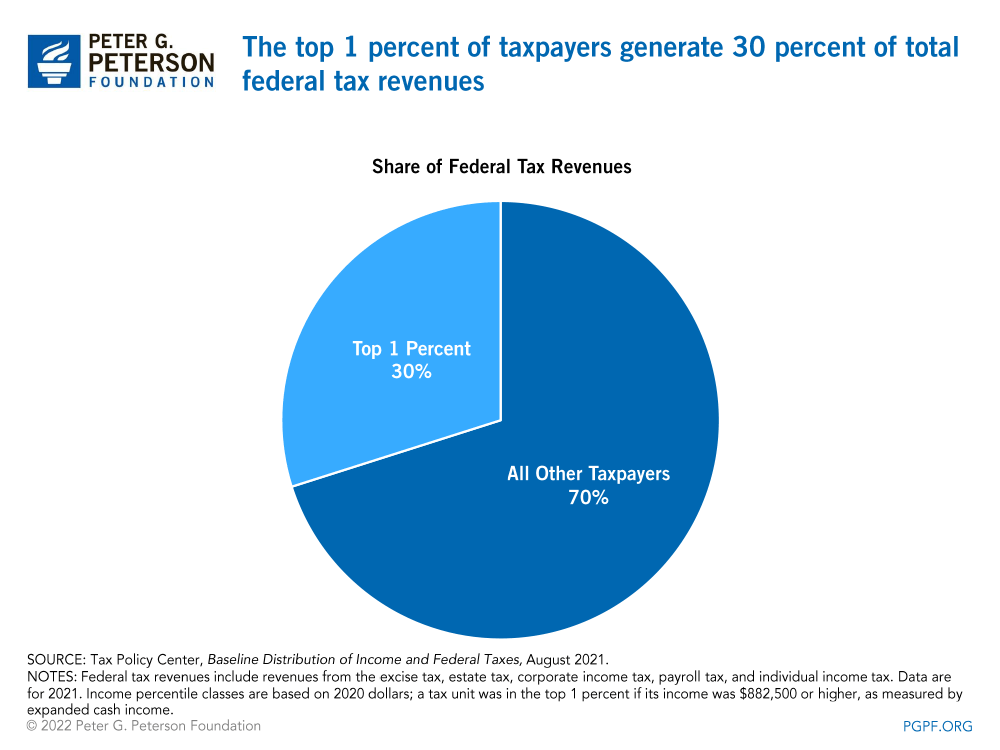
The top 1 percent of taxpayers generate 30 percent of individual income tax revenues.
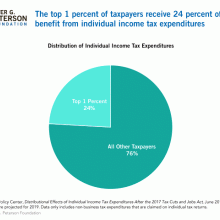
The top 1 percent of taxpayers receive 19 percent of the benefit from individual income tax expenditures.
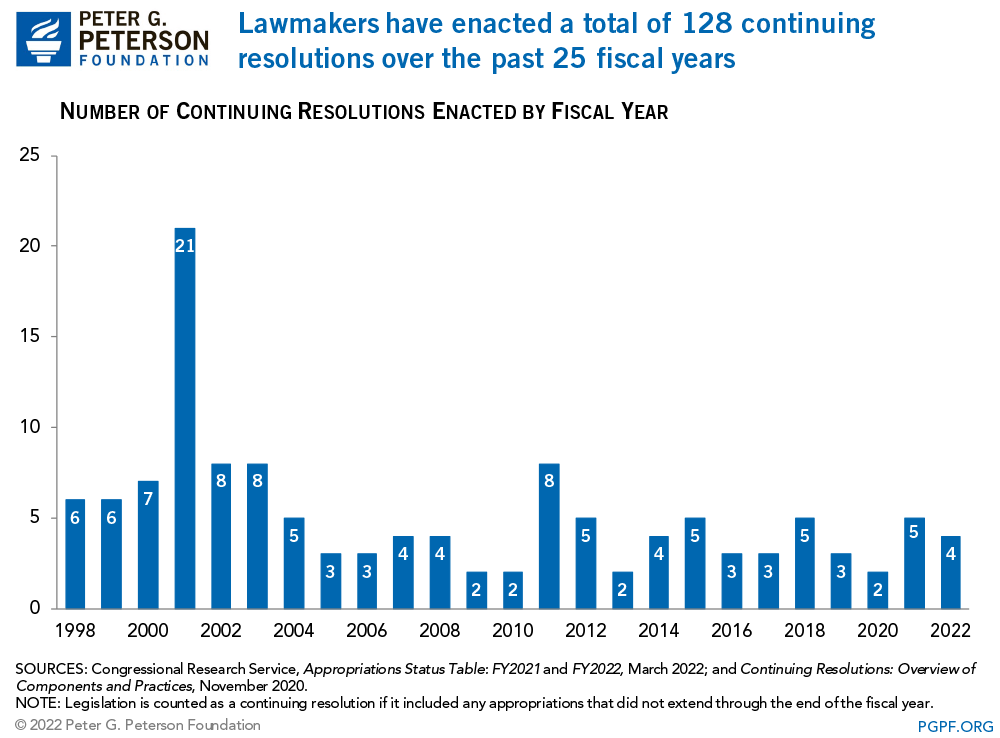
Lawmakers have enacted a total of 128 continuing resolutions over the past 25 fiscal years.
https://www.pgpf.org/chart-archive/0228_continuing_resolutions
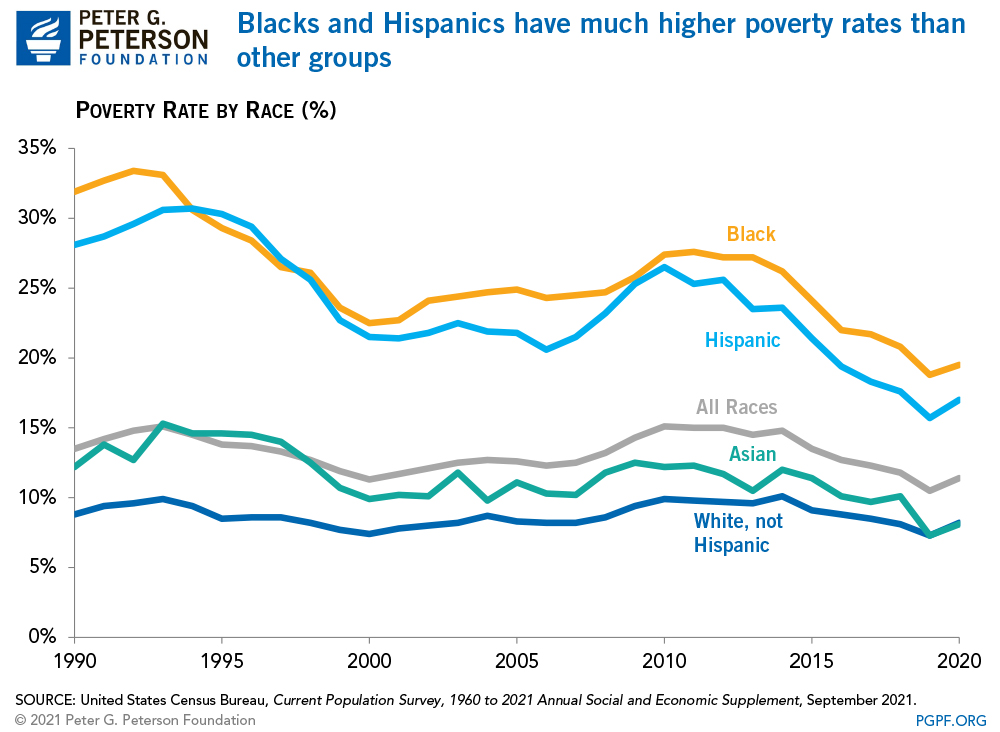
Blacks and Hispanics have much higher poverty rates than other groups.