Charts

Apr 16, 2024
PGPF Chart Pack
The PGPF chart pack illustrates that budget-making involves many competing priorities, limited resources, and complex issues.

The search found 146 results in 0.235 seconds.
The PGPF chart pack illustrates that budget-making involves many competing priorities, limited resources, and complex issues.
The top 20 percent of income earners receive over half the value of major tax expenditures.
https://www.pgpf.org/Chart-Archive/0199_distribution_tax_expenditures
Solutions Initiative 2019: Projected Federal Debt
https://www.pgpf.org/chart-archive/0279_solutions_initiative_2019
Spending for mandatory programs and net interest is projected to putpace all other non-interest spending.
https://www.pgpf.org/chart-archive/0174_SS_major_health_climb
Spending on the major healthcare programs, Social Security, and interest will continue to climb rapidly over the long term.
https://www.pgpf.org/chart-archive/0281_spending_to_climb_rapidly
The United States spends more on defense than the next 9 countries combined.
Following the 2017 tax reform, the federal statutory corporate tax rate in the United States is now more in line with many other OECD countries.
https://www.pgpf.org/chart-archive/0273_statutory_corporate_income_tax_rates
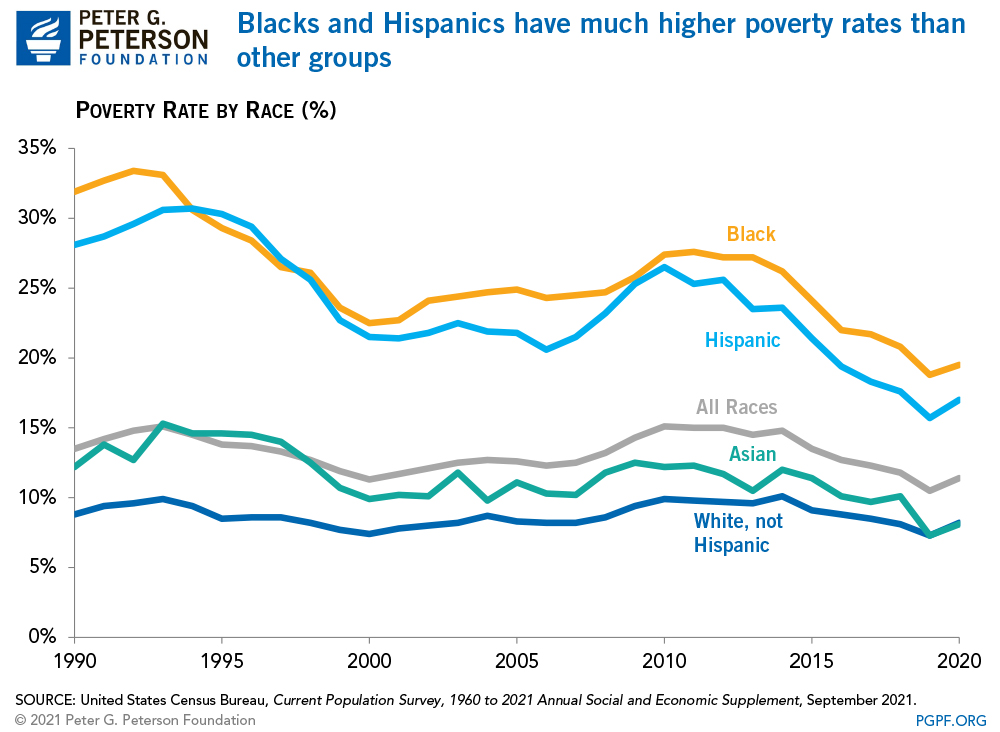
Blacks and Hispanics have much higher poverty rates than other groups.
Full-time male workers earn more than full-time female workers