Charts
Mar 22, 2022
Continuing Resolutions Since 1998
Lawmakers have enacted a total of 128 continuing resolutions over the past 25 fiscal years.
https://www.pgpf.org/chart-archive/0228_continuing_resolutions

The search found 267 results in 0.254 seconds.
Lawmakers have enacted a total of 128 continuing resolutions over the past 25 fiscal years.
https://www.pgpf.org/chart-archive/0228_continuing_resolutions
Medicare covers over 20 percent of most healthcare services.
https://www.pgpf.org/chart-archive/0092_medicare_share_costs
Medicaid finances almost one-fifth of healthcare spending in the United States.
https://www.pgpf.org/chart-archive/0095_medicaid_home_health
Over the past 50 years, the share of Medicare spending on hospital expenses has declined the most while the share spent on prescription drugs has increased the most
https://www.pgpf.org/chart-archive/0089_composition_medicare_payments

These charts tell the fiscal story of 2021 — looking back at how our fiscal situation deteriorated over the past year and what challenges lie ahead.
Prior to 2020, the median real income for families in the United States had been increasing for 5 consecutive years.
https://www.pgpf.org/chart-archive/0213_stagnant_median_income
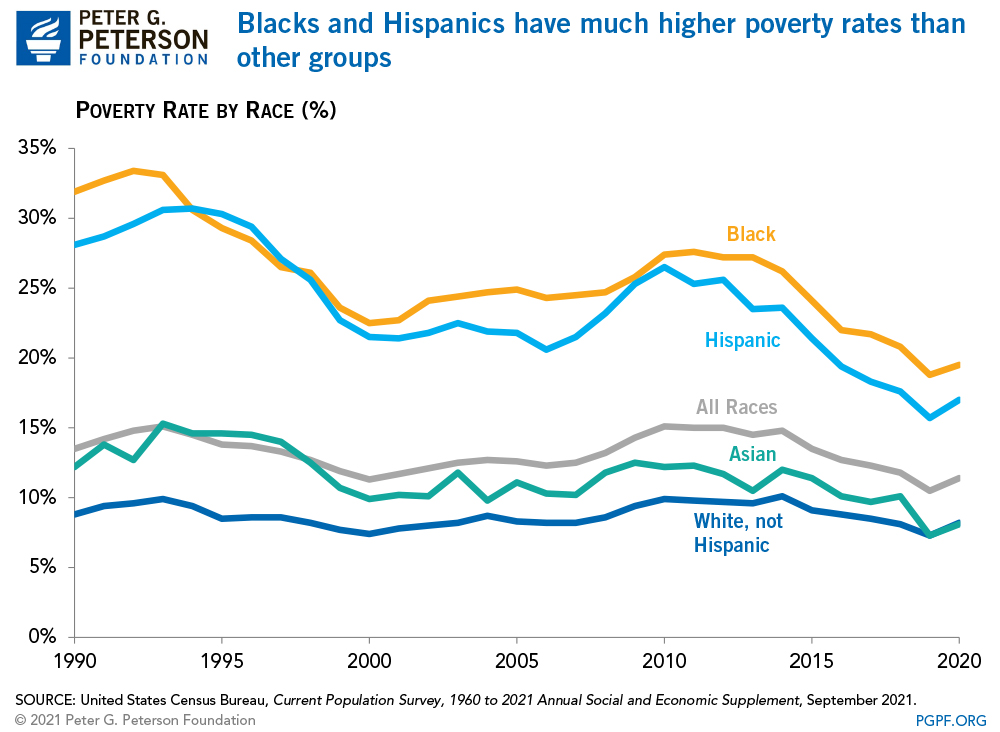
Blacks and Hispanics have much higher poverty rates than other groups.
Full-time male workers earn more than full-time female workers
There is a high rate of child poverty in the United States compared to other developed countries.
Income varies widely across racial and ethnic groups in the United States.
https://www.pgpf.org/chart-archive/0272_income_race_historical