Charts
Jul 10, 2019
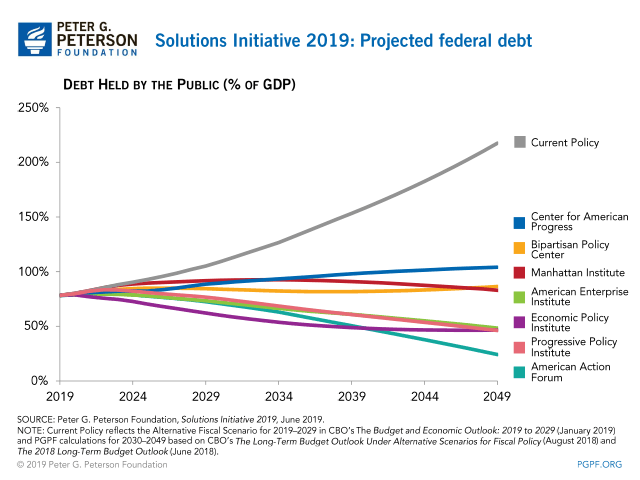
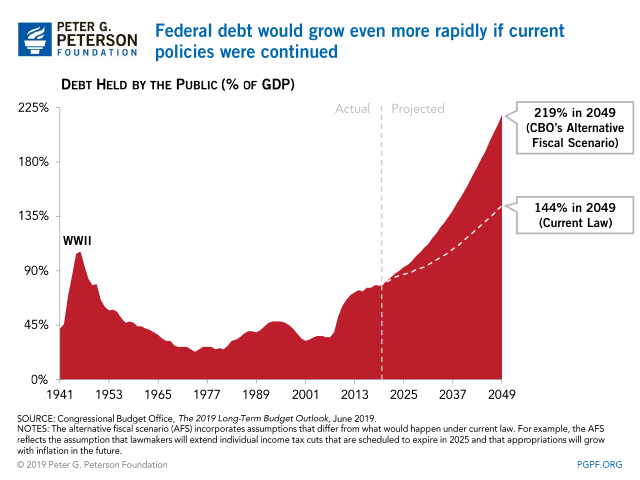
Solutions Initiative 2019: Projected federal debt chart
Solutions Initiative 2019: Projected Federal Debt
https://www.pgpf.org/chart-archive/0279_solutions_initiative_2019

The search found 146 results in 0.244 seconds.
Solutions Initiative 2019: Projected Federal Debt
https://www.pgpf.org/chart-archive/0279_solutions_initiative_2019
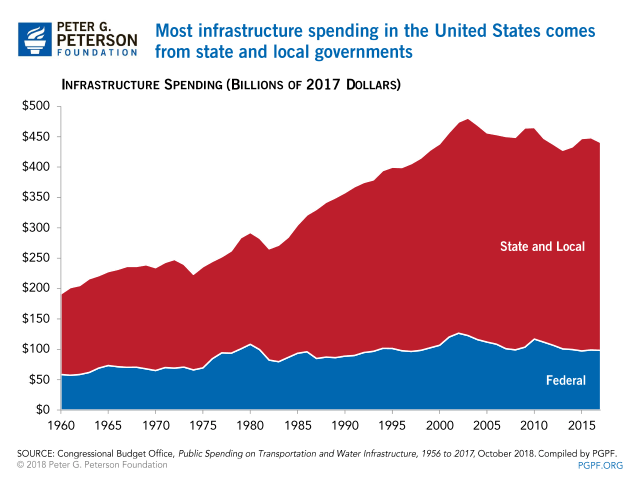
Most infrastructure spending in the United States comes from state and local governments
https://www.pgpf.org/chart-archive/0274_federal_state_local_infrastructure_spending
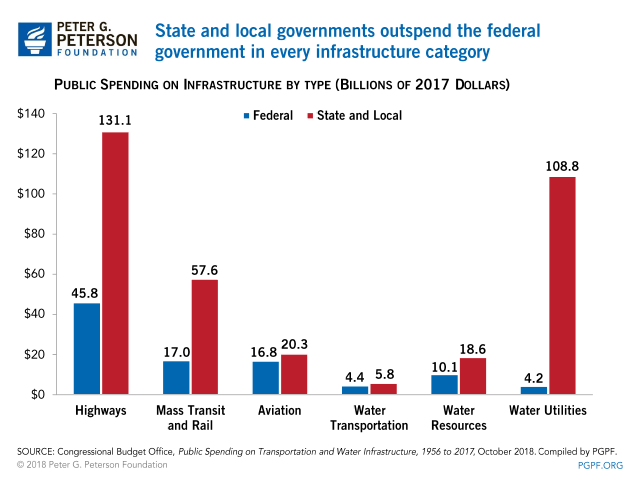
State and local governments outspend the federal government in every infrastructure category
https://www.pgpf.org/chart-archive/0275_infrastructure_spending_by_category
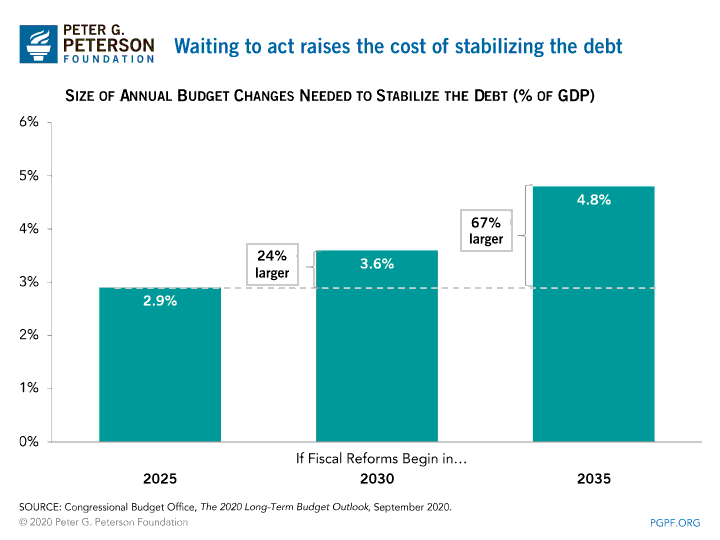
Waiting to act raises the cost of stabilizing the debt.
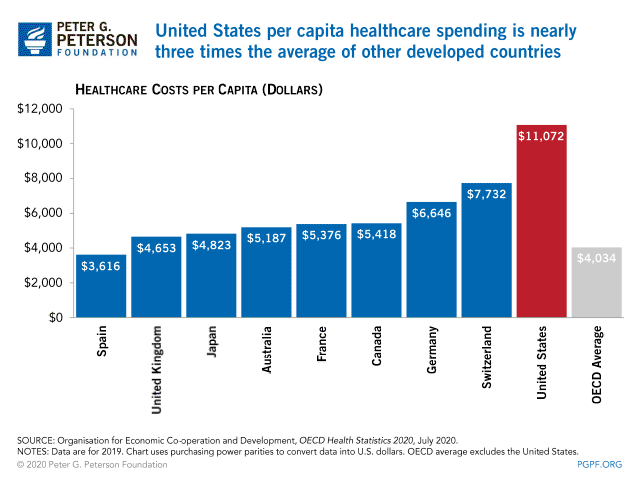
United States per capita healthcare spending is nearly three times the average of other developed countries.
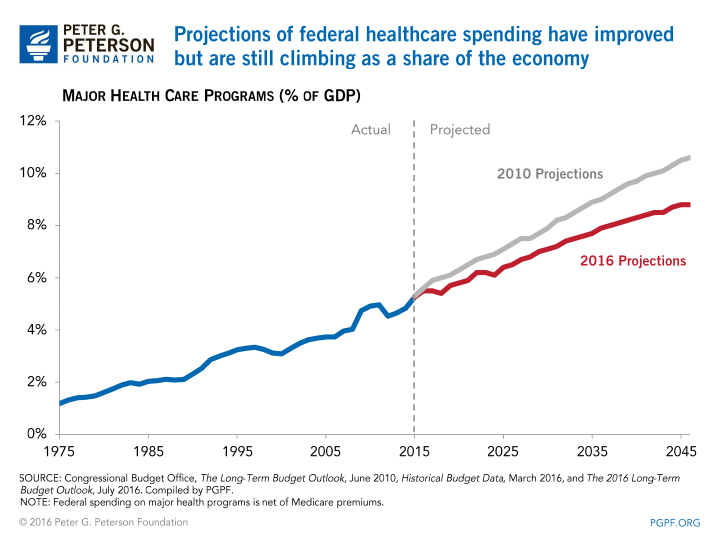
Projections of federal healthcare spending have improved but are still climbing as a share of the economy.
https://www.pgpf.org/chart-archive/0200_healthcare_share_econ_proj
PGPF Solutions Initiative III plans from five think tanks show declining federal debt through 2039.
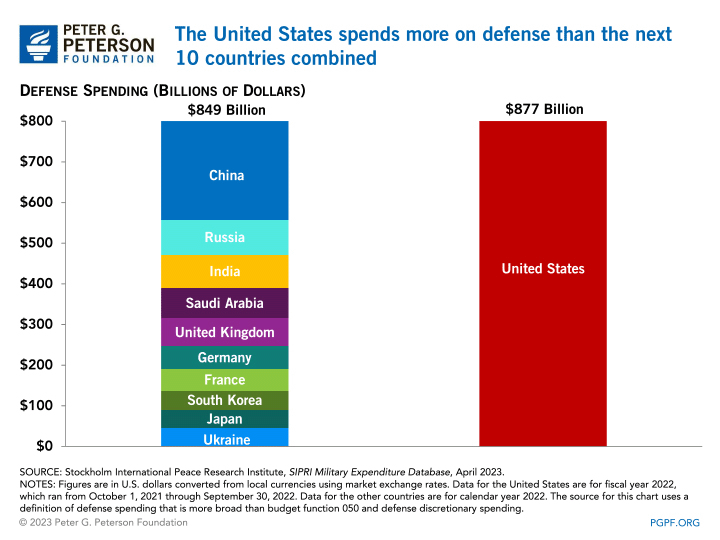
The United States spends more on defense than the next 9 countries combined.
The federal debt is on an unsustainable path

The PGPF chart pack illustrates that budget-making involves many competing priorities, limited resources, and complex issues.