Charts

May 16, 2024
PGPF Chart Pack
The PGPF chart pack illustrates that budget-making involves many competing priorities, limited resources, and complex issues.

The search found 146 results in 0.257 seconds.
The PGPF chart pack illustrates that budget-making involves many competing priorities, limited resources, and complex issues.
Following the 2017 tax reform, the federal statutory corporate tax rate in the United States is now more in line with many other OECD countries.
https://www.pgpf.org/chart-archive/0273_statutory_corporate_income_tax_rates
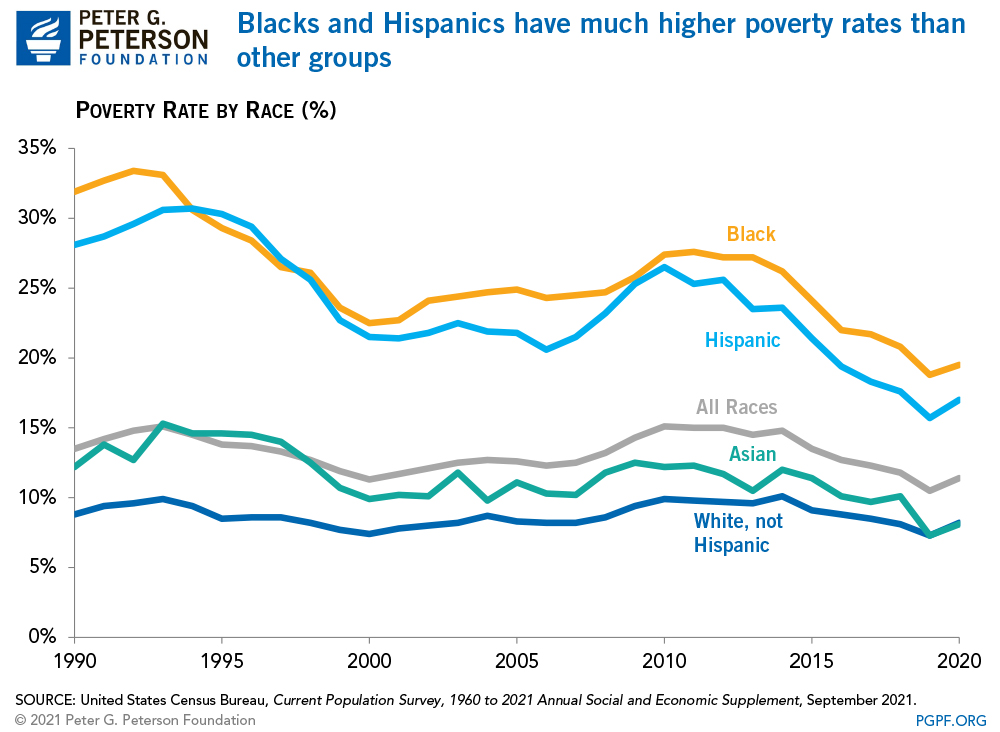
Blacks and Hispanics have much higher poverty rates than other groups.
The percentage of children without health insurance has declined since 1997.
CBO projects that interest rates will remain low throughout the decade.
https://www.pgpf.org/chart-archive/0269_interest_rates_projected_to_rise
The U.S. national saving rate has declined significantly since the mid-1960s.
The homeownership rate for young adult households has increased, but remains below it’s peak.
https://www.pgpf.org/chart-archive/0227_young_adult_home_own
Spending for mandatory programs and net interest is projected to putpace all other non-interest spending.
https://www.pgpf.org/chart-archive/0174_SS_major_health_climb
Spending on the major healthcare programs, Social Security, and interest will continue to climb rapidly over the long term.
https://www.pgpf.org/chart-archive/0281_spending_to_climb_rapidly