Charts
May 4, 2019
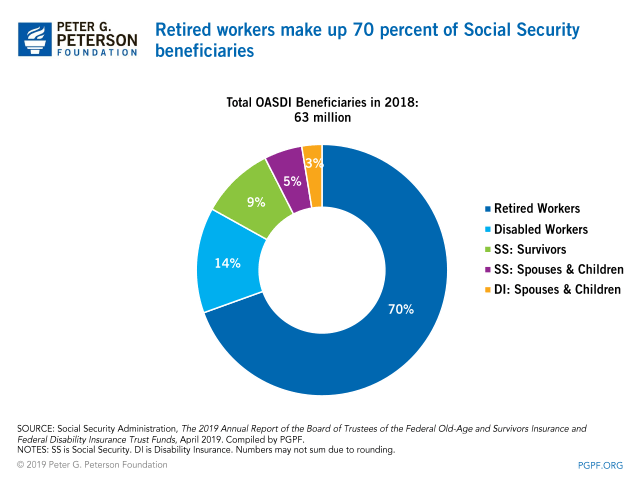
OASDI Beneficiary Percentages
Retired workers make up 70 percent of Social Security beneficiaries.
https://www.pgpf.org/chart-archive/0243_oasdi-beneficiary-percentages

The search found 405 results in 1.288 seconds.
Retired workers make up 70 percent of Social Security beneficiaries.
https://www.pgpf.org/chart-archive/0243_oasdi-beneficiary-percentages
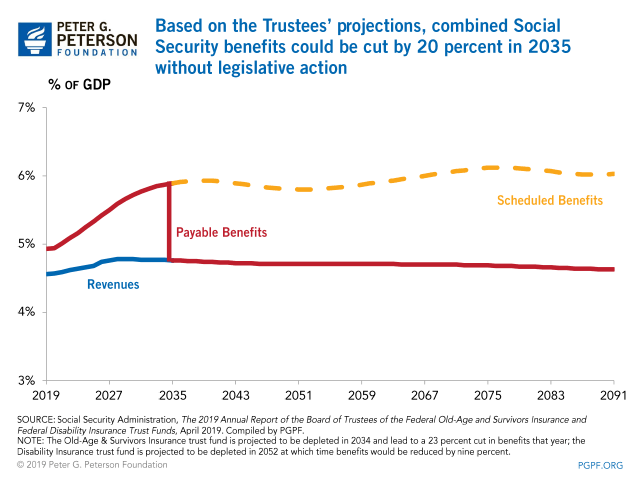
Based on the Trustees’ projections, combined Social Security benefits could be cut by 20 percent in 2035 without legislative action
https://www.pgpf.org/chart-archive/0246_social-security-20-percent-cut
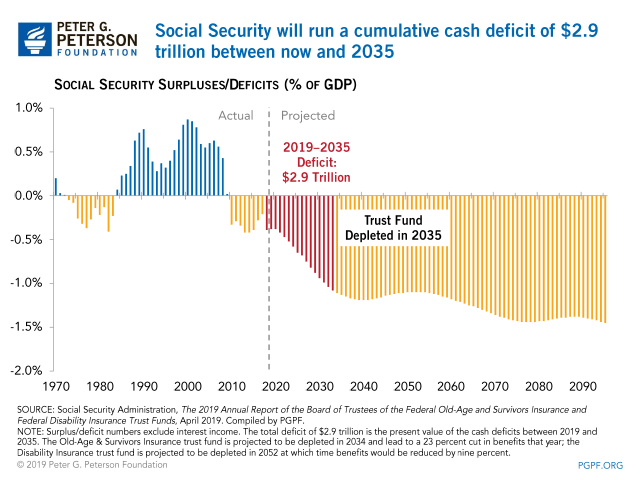
Social Security will run a cumulative cash deficit of $2.9 trillion between now and 2035.
https://www.pgpf.org/chart-archive/0030_social-security-deficits-gdp
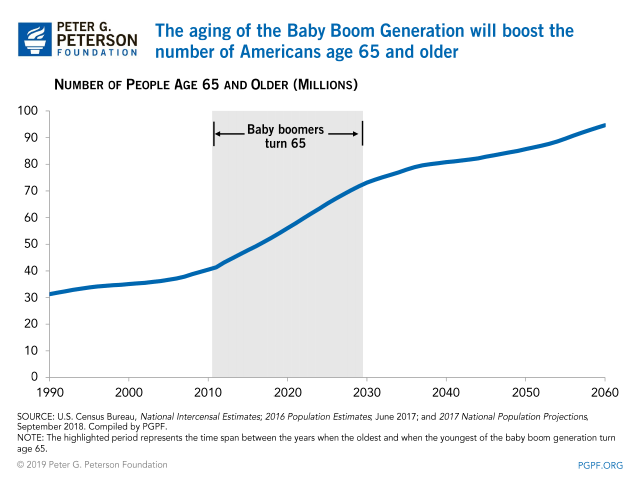
The aging of the baby boom generation will boost the number of Americans age 65 and older.
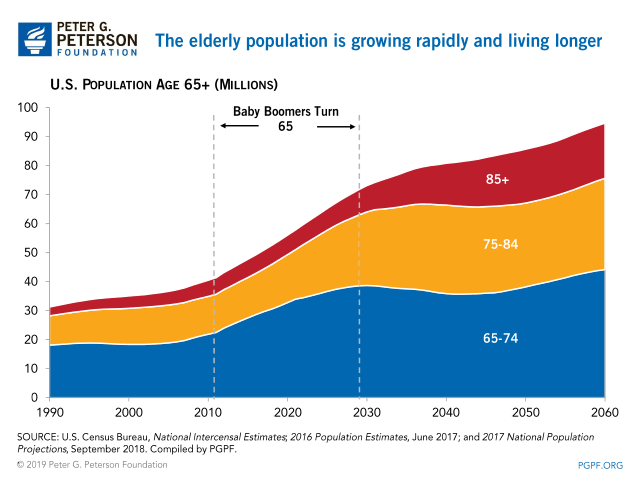
The elderly population is growing rapidly and living longer.
https://www.pgpf.org/chart-archive/0045_elderly-population-trends
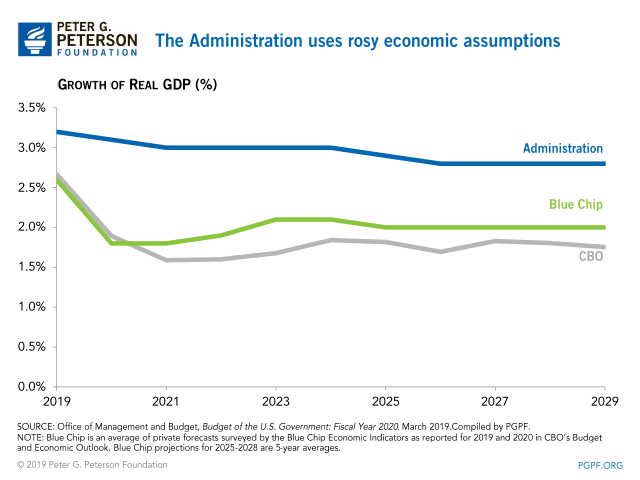
The Administration uses rosy economic assumptions.
https://www.pgpf.org/chart-archive/0268_rosy_economic_assumptions
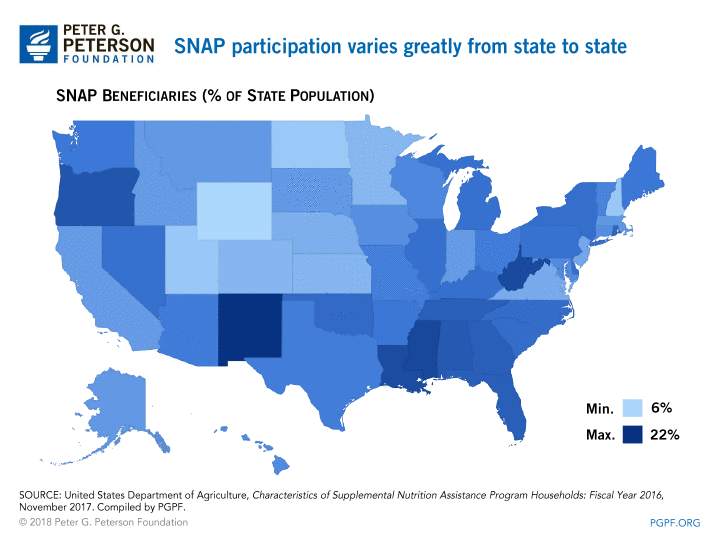
SNAP participation varies greatly from state to state.
https://www.pgpf.org/chart-archive/0263_snap_participation_varies_state

A key assessment of poverty in America is the Official Poverty Measure (OPM), which is calculated by the United States Census Bureau using a range of income and economic data.
https://www.pgpf.org/budget-basics/how-do-we-measure-poverty-and-is-there-a-better-way-to-do-it
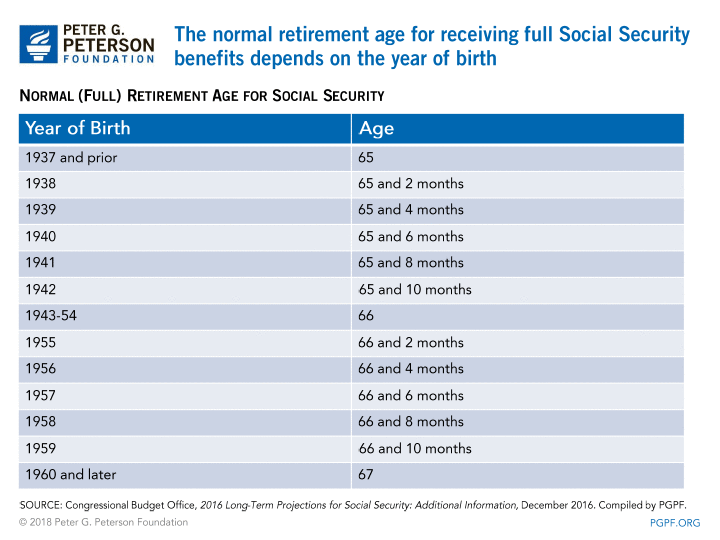
The normal retirement age for receiving full Social Security benefits depends on the year of your birth.
https://www.pgpf.org/chart-archive/0245_social-security-year-of-birth

This paper examines trends in important demographic drivers of fertility—such as women’s intentions to have children, postponed childbearing, and migration—to better understand the implications of the recent fertility decline for future fertility patterns.