Charts

The search found 146 results in 0.331 seconds.
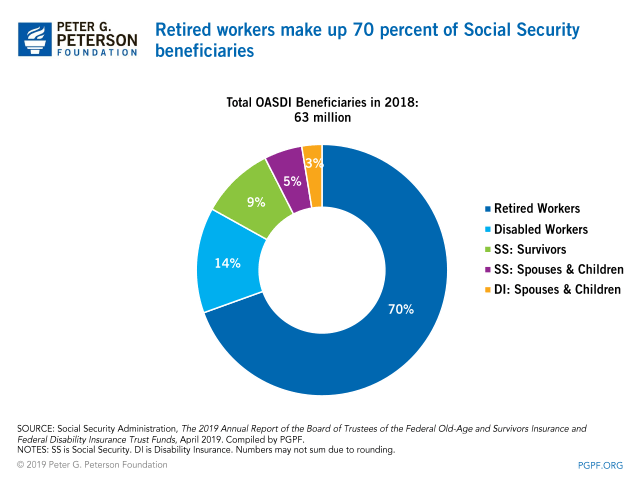
Retired workers make up 70 percent of Social Security beneficiaries.
https://www.pgpf.org/chart-archive/0243_oasdi-beneficiary-percentages
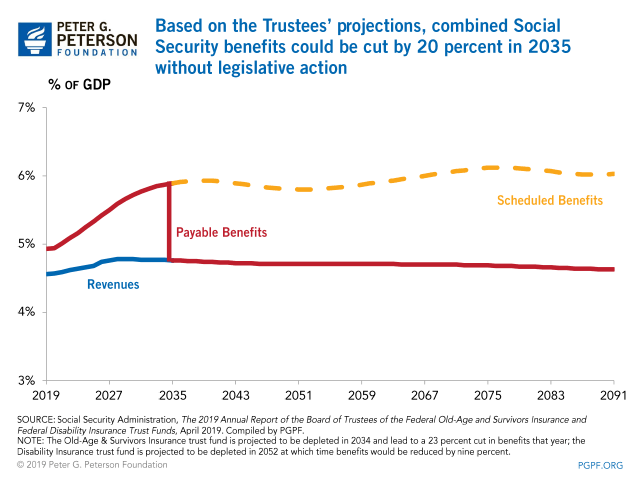
Based on the Trustees’ projections, combined Social Security benefits could be cut by 20 percent in 2035 without legislative action
https://www.pgpf.org/chart-archive/0246_social-security-20-percent-cut
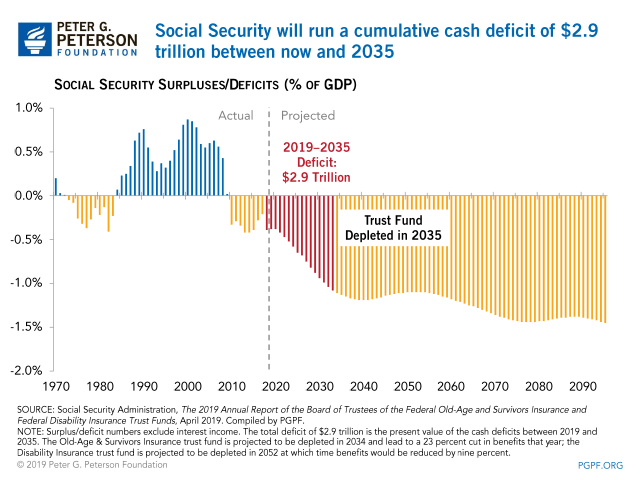
Social Security will run a cumulative cash deficit of $2.9 trillion between now and 2035.
https://www.pgpf.org/chart-archive/0030_social-security-deficits-gdp
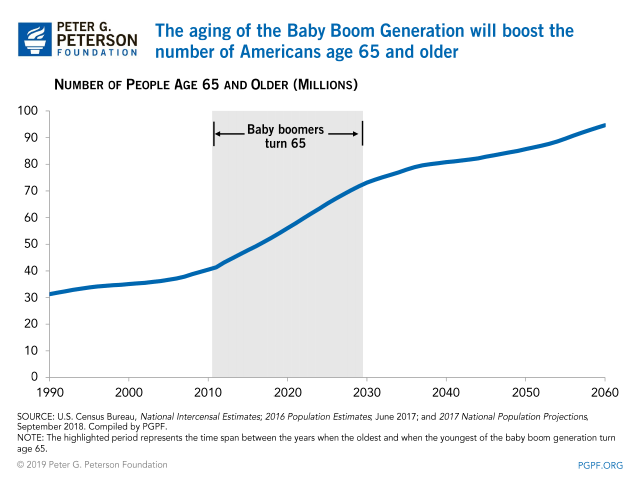
The aging of the baby boom generation will boost the number of Americans age 65 and older.
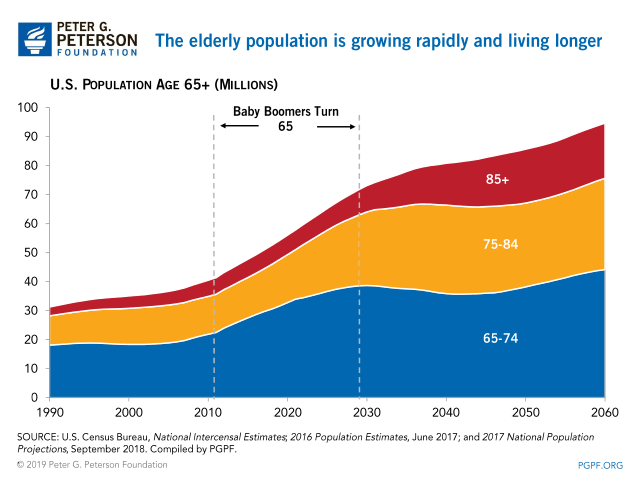
The elderly population is growing rapidly and living longer.
https://www.pgpf.org/chart-archive/0045_elderly-population-trends
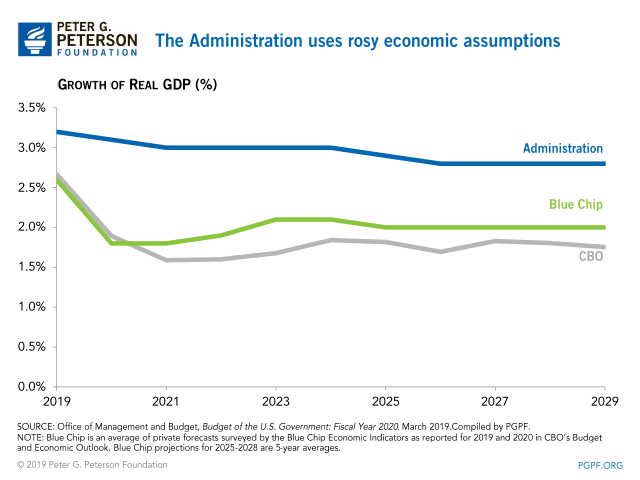
The Administration uses rosy economic assumptions.
https://www.pgpf.org/chart-archive/0268_rosy_economic_assumptions
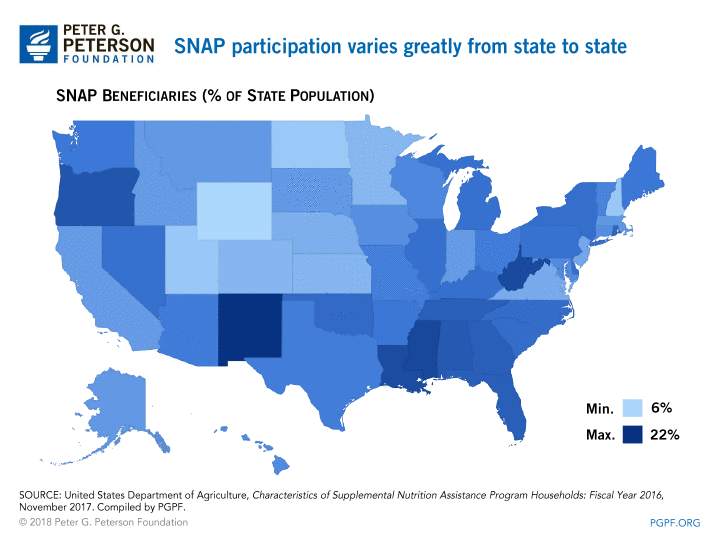
SNAP participation varies greatly from state to state.
https://www.pgpf.org/chart-archive/0263_snap_participation_varies_state
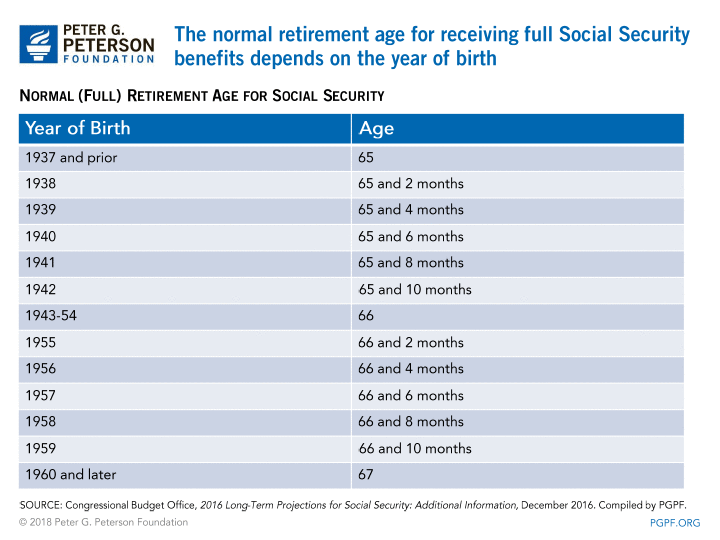
The normal retirement age for receiving full Social Security benefits depends on the year of your birth.
https://www.pgpf.org/chart-archive/0245_social-security-year-of-birth
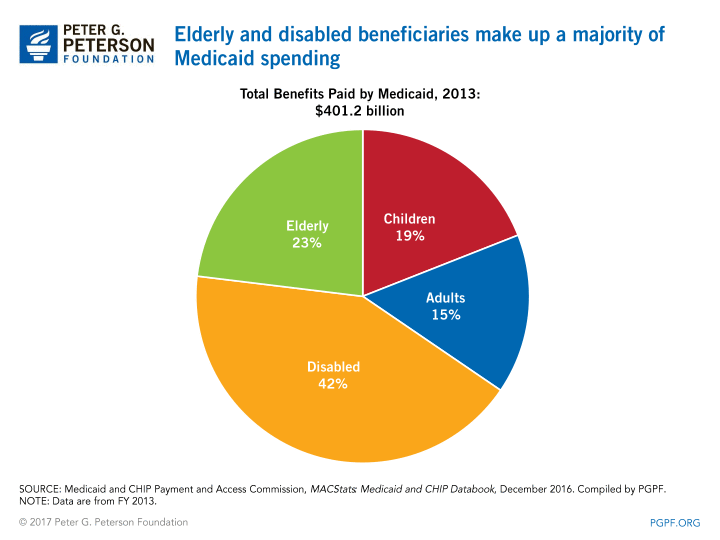
Elderly and disabled beneficiaries make up a majority of Medicaid spending.
https://www.pgpf.org/chart-archive/0094_spending_medicaid_beneficiaries