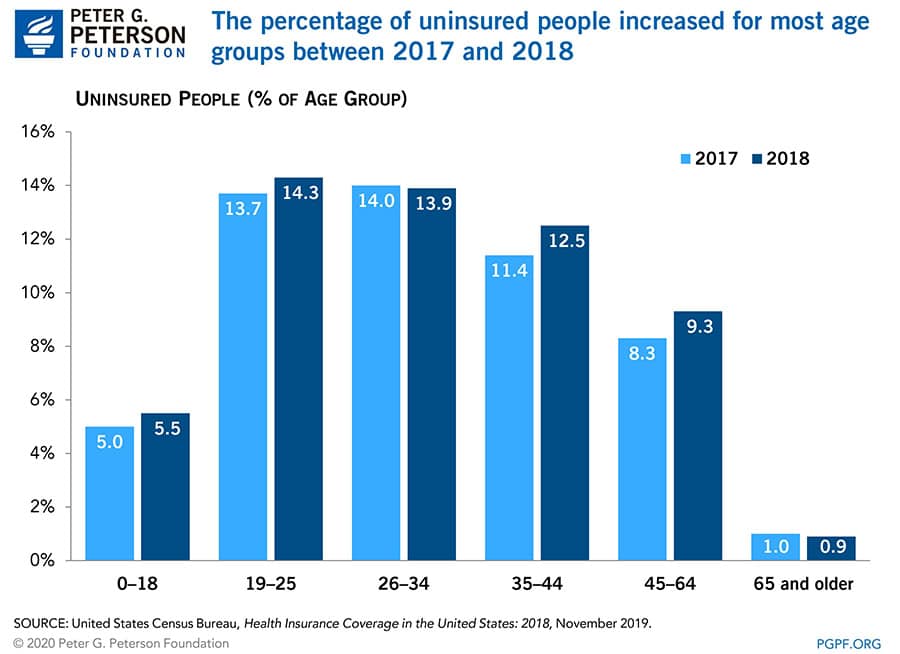
Millions of people gained healthcare coverage under the Affordable Care Act (ACA), sometimes referred to as “Obamacare,” but the proportion of the population who are uninsured began increasing in 2017. The latest report by the United States Census Bureau on Health Insurance Coverage focuses on data from 2018 and indicates that 27.5 million people were uninsured in that year — an increase of 1.9 million from the year prior.
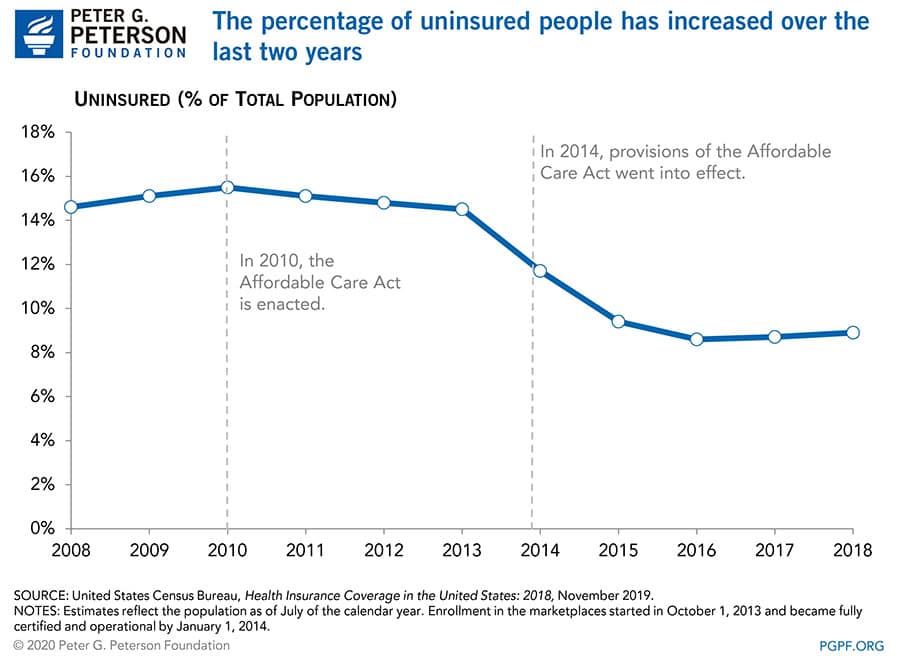
Economic trends, demographics and policy changes can influence access to care. In the decade before the enactment of the ACA in 2010, the average uninsured rate was 14 percent. In 2014, provisions of the ACA went into effect, which enabled states to expand Medicaid eligibility and established health insurance marketplaces. Those policy changes resulted in a 3-percentage-point decrease in the share of uninsured people that year. Additional states adopted Medicaid expansion in the following years, contributing to subsequent declines in the uninsured rate.
The exact factors that pushed up the uninsured rate in 2018 are unclear. Partially driving the increase were efforts to challenge and loosen requirements of the ACA. Such efforts include the repeal in 2017 of the individual mandate; without a penalty for not having health insurance, some individuals opted to forgo coverage.
Changes in Public and Private Coverage
Health insurance is provided through various sources in both the private and public sectors. The Census Bureau defines the programs in each sector:
- Private Insurance includes employer-based insurance plans and plans purchased directly from a marketplace. It also includes TRICARE, which serves members of the military.
- Public Insurance includes Medicare, Medicaid, the Children’s Health Insurance Program (CHIP), and veterans’ health programs.
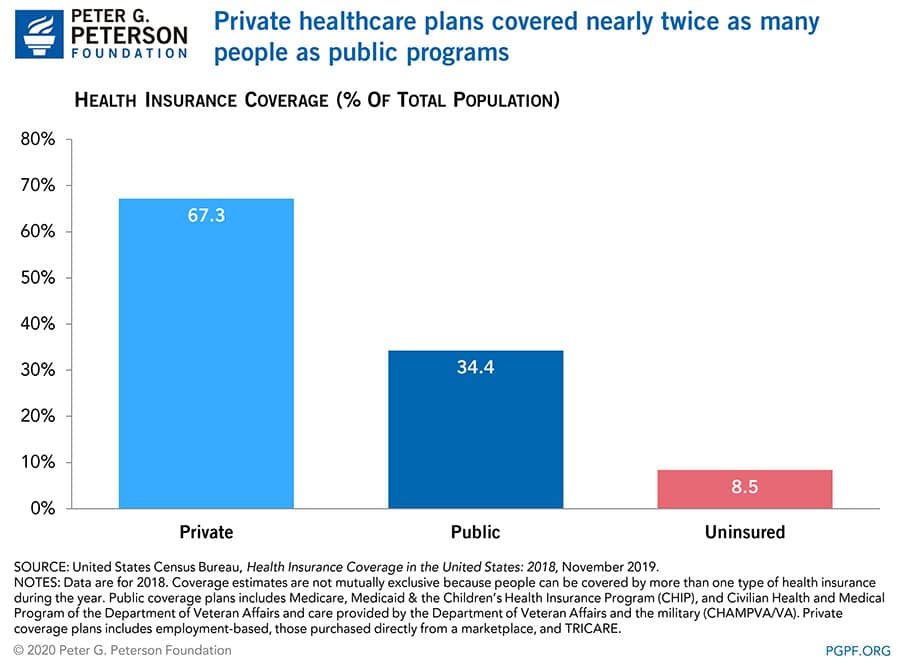
In 2018, private health programs covered nearly twice as many Americans as did public programs. Coverage estimates are not mutually exclusive because people can be covered by more than one type of health insurance during the year. Of those who were covered by health insurance at some point in 2018, 218 million people were enrolled in a private program and 111 million in a public program. Those totals represent an enrollment drop of 0.4 million people in private plans and 0.8 million people in public plans from 2017.
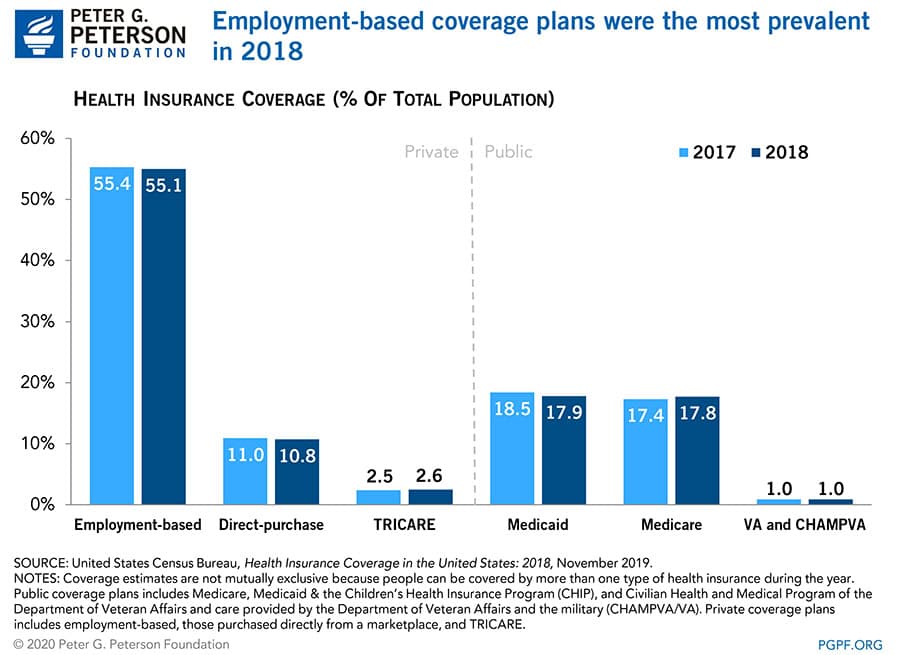
Employment-based plans accounted for more than half of the population with insurance in 2018; the next largest sources of coverage were Medicaid and Medicare, at around 18 percent of the population each. Enrollment in employment-based plans dropped to 178.4 million in 2018 as rising premiums and deductibles priced out about 0.4 million individuals who were previously enrolled. Enrollment in Medicare was 57.7 million people in 2018, an increase of about 1.5 million people from 2017; that change was mostly the result of growth in the number of people age 65 and over. In contrast, Medicaid enrollment declined by nearly 2 million people to 57.8 million as states tightened eligibility through renewal processes and periodic eligibility checks.
Health Coverage by Age
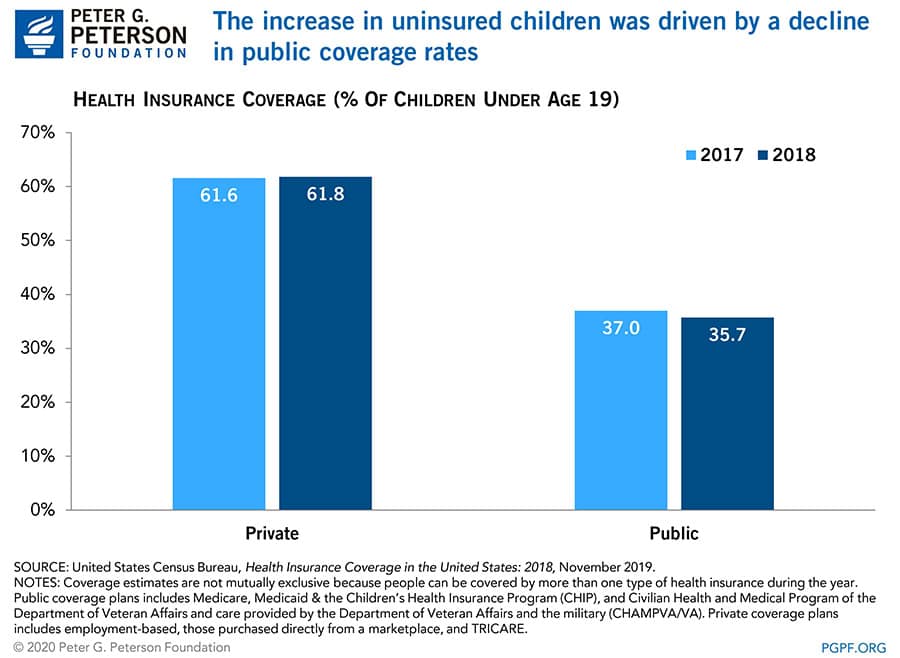
Americans age 65 and older had the lowest uninsured rates with 94 percent enrolled in Medicare. Conversely, nearly three-quarters of working-age adults — those between ages 19 and 64 — were enrolled in a private insurance plan. Working-age adults had the highest uninsured rates, rising noticeably in 2018, with enrollment declining more for public programs than for private programs. According to a Kaiser Family Foundation analysis, nearly half of uninsured working-age adults cited high costs as the main reason they lacked coverage. In states that did not expand Medicaid eligibility, many working-age adults fell into a “coverage gap,” earning too much to qualify for Medicaid, but not enough to qualify for premium tax credits that make private insurance affordable. For children under age 19, enrollment in private health plans remained stable as 62 percent of children were covered in 2018. However, 5.5 percent of children nationwide were uninsured, an increase of 0.6 percentage points from the year prior.
The increase to children’s uninsured rate was driven by a 1.3-percentage-point decrease in Medicaid and CHIP enrollment. Children’s uninsured rates differed across states and were largely dependent on whether a state expanded Medicaid eligibility.
Coverage by Region
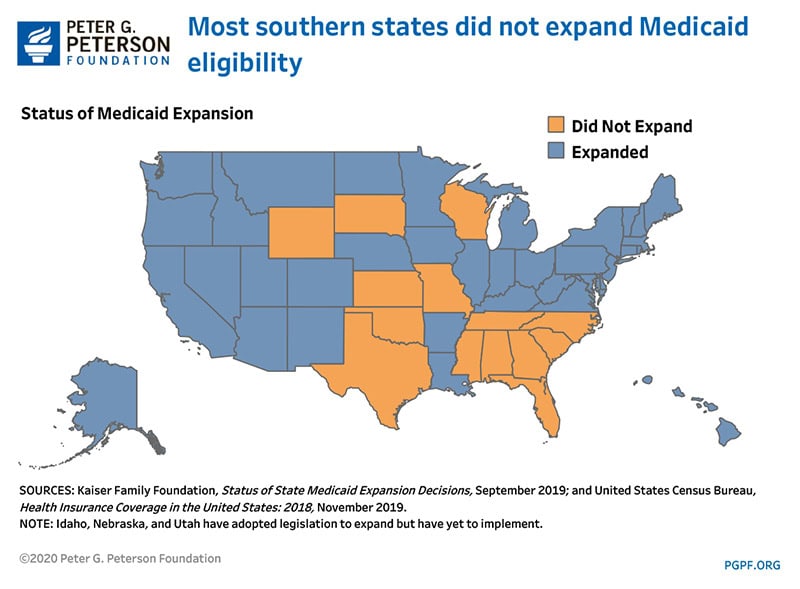
As part of the ACA, 31 states expanded Medicaid eligibility before January 2018. Since then, five more states and the District of Columbia have expanded eligibility, bringing the total to 37 states and jurisdictions. In 2018, states that expanded eligibility had an average uninsured rate of 6.6 percent while those that did not averaged 12.4 percent.
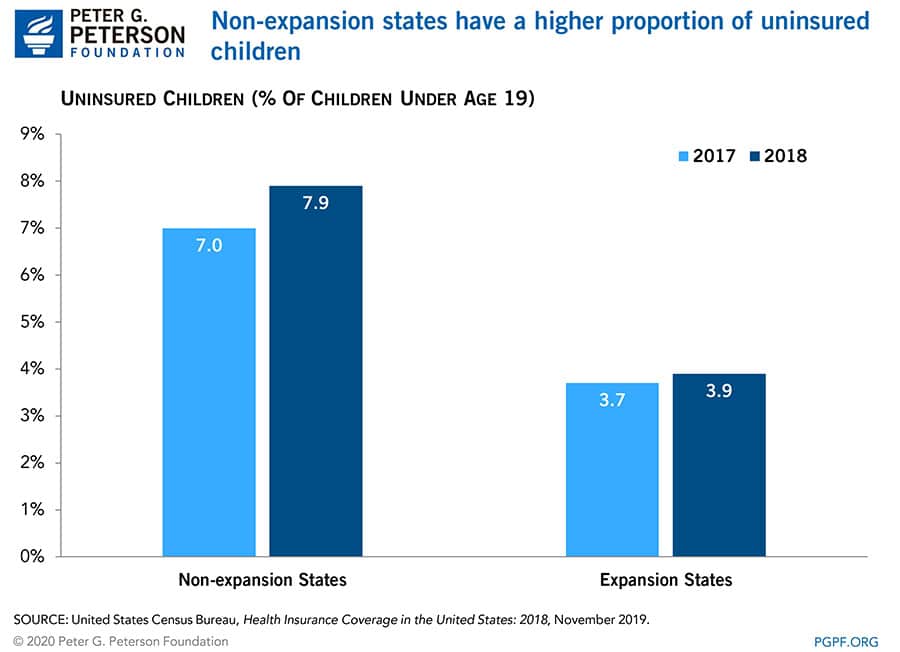
The status of Medicaid expansion also revealed different uninsured rates for children. Census data shows that non-expansion states exhibited a higher proportion of uninsured children in 2018.
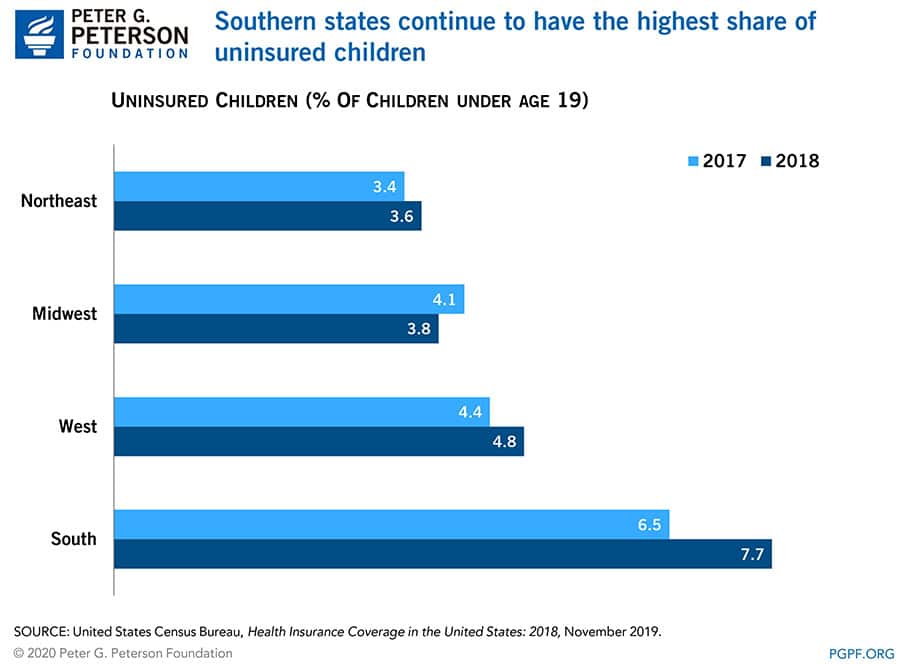
Southern states — most of which did not expand Medicaid — generally had the highest rates of uninsured children, an average of 7.7 percent. By comparison, that is higher than the national average of 5.5 percent and twice as much as the northeast region’s rate of 3.6 percent. In addition, southern states also experienced the largest increase in the share of uninsured children, which grew by 1.2 percentage points in 2018.
Looking Forward
While the number and share of people with healthcare coverage is declining, total U.S. healthcare spending is projected to rise to nearly one-fifth of the economy by 2025. The growing disparity in federal spending and coverage rates underscores the need to identify and implement solutions to improve healthcare performance in the United States and address a key driver of the federal debt.
Image credit: Photo by Spencer Platt/Getty Images
Further Reading
Quiz: How Much Do You Know About Healthcare in the United States?
The United States has one of the largest and most complex healthcare systems in the world. Take our healthcare quiz to see how much you know about the cost and quality of the U.S. healthcare system.
How Did the One Big Beautiful Bill Act Change Healthcare Policy?
The OBBBA adds significantly to the nation’s debt, but its healthcare provisions lessen that impact by $1.0 trillion.
Infographic: U.S. Healthcare Spending
Improving our healthcare system to deliver better quality care at lower cost is critically important to our nation’s long-term economic and fiscal well-being.

