
You are here
Social Security’s Funding Gap is 1.3% of GDP — Here’s How We Can Close It

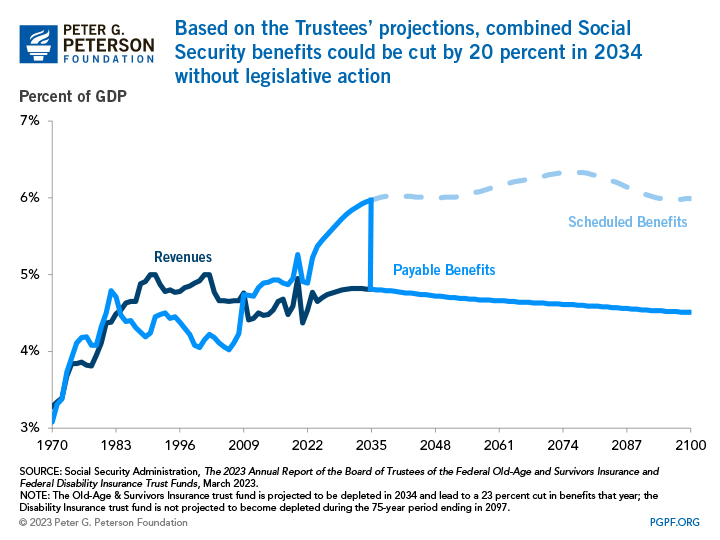
As the largest program in the federal budget, Social Security is an integral part of the nation’s fiscal picture and a vital economic lifeline for millions of recipients. However, the aging of the population is putting pressure on the program’s finances, leading to a rising imbalance between Social Security’s costs and revenues. Without reform, the combined Social Security trust funds will be depleted by 2034 and beneficiaries could see a 20 percent cut in their benefits in that year. Fortunately, there are a range of solutions available to secure the program. Here, we examine the gap between the program’s revenues and outlays and evaluate how various policy options could close that gap.
What Is the Social Security Funding Gap?
Social Security is comprised of two programs — Old-Age and Survivors Insurance (OASI) and Disability Insurance (DI), each with its own trust fund. Although the two programs are separate, the funding gap is often applied to the combined program (OASDI); that gap can be measured by the difference between revenues dedicated to the program and the scheduled payments to beneficiaries over the span of 75 years. In the past, Social Security collected more income than outgoing expenses, reflecting a greater number of younger workers paying into the program, but as of 2010, benefits have consistently outpaced revenues. According to the Social Security Trustees, if Social Security paid benefits as scheduled, spending on the program would rise from 5.0 percent of gross domestic product (GDP) in 2022 to 6.0 percent in 2096. Revenues, meanwhile, would remain around 4.6 percent of GDP over that period.
To close the funding gap and sustain the program for the next 75 years, lawmakers would need to enact solutions equivalent to 1.3 percent of GDP in 2022, according to the Trustees. That projection is up from last year’s calculation of 1.2 percent of GDP. Options to close the shortfall address both increasing revenues and reducing spending. Ideally, a combination of solutions would be enacted to close the gap in the trust fund and help its long-term sustainability.
Options to increase revenues and reduce spending can close the Social Security funding gap
| Options to Increase Revenues | Funding Gap Covered (% of GDP) |
|---|---|
| Eliminate taxable maximum | 0.88 |
| Increase payroll tax by 1% | 0.36 |
| Subject cafeteria plans to payroll tax | 0.13 |
| Cover newly-hired government employees | 0.04 |
| Options to Reduce Spending | Funding Gap Covered (% of GDP) |
| Grow initial benefits with prices instead of wages | 1.26 |
| Raise full retirement age to 69 | 0.47 |
| Reduce initial benefits for high earners | 0.44 |
| Calculate cost of living adjustment using chained CPI | 0.23 |
| Expand earning years included for benefits calculation from 35 to 40 | 0.17 |
SOURCE: Social Security Administration, The 2023 Annual Report of the Board of Trustees of the Federal Old-Age and Survivors Insurance and Federal Disability Insurance Trust Funds,, March 2023; and Committee for a Responsible Federal Budget, Ten Options To Secure the Social Security Trust Fund, February 2022.
NOTES:Estimates are based on GDP in 2022.
© 2023 Peter G. Peterson Foundation
Options to Increase Social Security Revenues
The main mechanism that solutions focus on to increase Social Security revenues is through tax increases. However, as outlined below, that is not the only way to raise revenues for the program.
Eliminate Taxable Maximum on Earnings
Of the options presented, the one that would increase revenues the most would be to eliminate the “taxable maximum.” In 2022, the maximum taxable earnings was $147,000 (and has risen to $160,200 for 2023); eliminating the cap would help close the funding gap by 0.88 percent of GDP. When payroll taxes for Social Security were first collected in 1937, 92 percent of earnings from jobs covered by the program were below the maximum taxable amount. By 2020, that number had decreased to 83 percent of earnings.
Increase the Payroll Tax
A commonly raised solution is to increase the payroll tax rate for Social Security. Raising the payroll tax 1 percentage point from 12.4 percent to 13.4 percent would also help the solvency gap and bring in $1.0 trillion over 10 years, or 0.36 percent of GDP. Both employees and employers would bear half of the tax increase.
Subject Cafeteria Plans to the Payroll Tax
Cafeteria plans allow workers to accept fringe benefits on a pre-tax basis. Some common uses are to help pay for supplemental health insurance coverage, the employee’s share of their premiums, medical expenses through Flexible Savings Accounts and Health Savings Accounts, and dependent care costs like daycare. Cafeteria plans reduce an employee’s taxable income under both the income tax and payroll tax, but if they were subject to the payroll tax, an estimated $470 billion could be raised over a decade and eliminate 0.13 percent of GDP from the funding gap.
Cover Newly-Hired State and Local Government Employees
Finally, covering newly-hired state and local government employees could increase revenues by a small amount. Federal law allows state and local government employees to opt out of enrolling in Social Security if they are given an option for a separate retirement plan. As a result, about a quarter of workers employed by state and local governments are not covered by Social Security. This option would reduce Social Security deficits more in the near-term because the initial increase in revenues would eventually be offset by paying out benefits in the long term. On net, it would close the 75-year actuarial deficit by less than 0.1 percent of GDP.
Options to Reduce Social Security Spending
Reducing spending on Social Security is another primary way to close its funding gap. Many of the proposals here accomplish a reduction in spending through adjustments to the way benefits are calculated.
Grow Initial Benefits with Prices
One option that would nearly close the gap entirely is growing initial benefits with prices instead of wages. Currently, Social Security benefits are based on average lifetime earnings with the idea that a worker’s future benefits reflect the general rise in the standard of living during their working years. An alternative, often called “pure” pricing indexing, would base benefit payments on inflation-adjusted wages. It means increases in average real wages would not result in higher real benefits, while at the same time it would help raise some revenues because it would result in higher real payroll taxes. Linking benefits in that way would reduce overall benefit payments and close 97 percent of the gap of 1.3 percent GDP.
Increase the Full Retirement Age
Another proposal is to increase the retirement age to account for longer lifespans. Under current law, the retirement age will gradually increase to 67 years of age by 2027. A proposal to further increase the full retirement age to 69 and then index it for life expectancy would help close the structural gap by 0.47 percent of GDP.
Calculate Cost of Living Adjustment Using Chained CPI
Increasing benefit payments for low earners and reducing payments for others would result in a net effect of closing the gap by 0.44 percent of GDP. The primary insurance amount (PIA) is the benefit a person receives at the normal retirement age. The PIA a person receives is based on bins of average monthly earnings, and higher earners see a lower replacement rate of their earnings. Adjusting the points to reduce the PIA for high earners and increase it for lower-earners would have the net effect of reducing Social Security spending.
Reduce Initial Benefits for High Earners
Another option would focus on how cost of living adjustments are calculated. The consumer price index for urban wage earners and clerical workers (CPI-W) is the current way cost of living adjustments for benefits are calculated, but Social Security costs could be reduced if that formula were based off the chained consumer price index for all urban consumers (C-CPI-U) instead. The difference between the two measures of inflation lies in population coverage, with the CPI-W focusing only on workers and the C-CPI-U including all urban consumers. Additionally, the C-CPI-U uses different expenditure weights to produce aggregate measures of price change. Analysts believe the C-CPI-U is a more accurate measure to capture the growth in the cost of living because it accounts for the substitution of goods and services when prices rise. That formula adjustment could close the funding gap by 0.23 percent of GDP.
Increase Amount of Earnings Years Included to Calculate Benefits
A different facet of changing how benefits are calculated is by adjusting the number of years included in a worker’s average lifetime earnings. Benefit amounts are calculated using average lifetime earnings over the span of 35 years, and one proposal is to consider the average over 40 years instead. That means years with lower or zero-earnings would be included in that average and reduce the benefits amount. Making that adjustment would reduce the actuarial deficit amount by 0.17 percent of GDP.
Conclusion
With the OASDI trust fund projected to reach depletion in just 11 years and the 75-year funding gap representing 1.3 percent of current GDP, lawmakers will need to take action on Social Security or millions of recipients will receive a cut in their benefits. The good news is that there are numerous options to secure the OASDI trust fund using a range of policy levers. Whether closing the funding gap is achieved by increasing revenues, reducing spending, or a combination of approaches, policymakers have many options available to strengthen Social Security for the long term.
Related: Without Reform, Social Security Could Become Depleted Within The Next Decade
Image credit: Photo by Brandon Bell/Getty Images