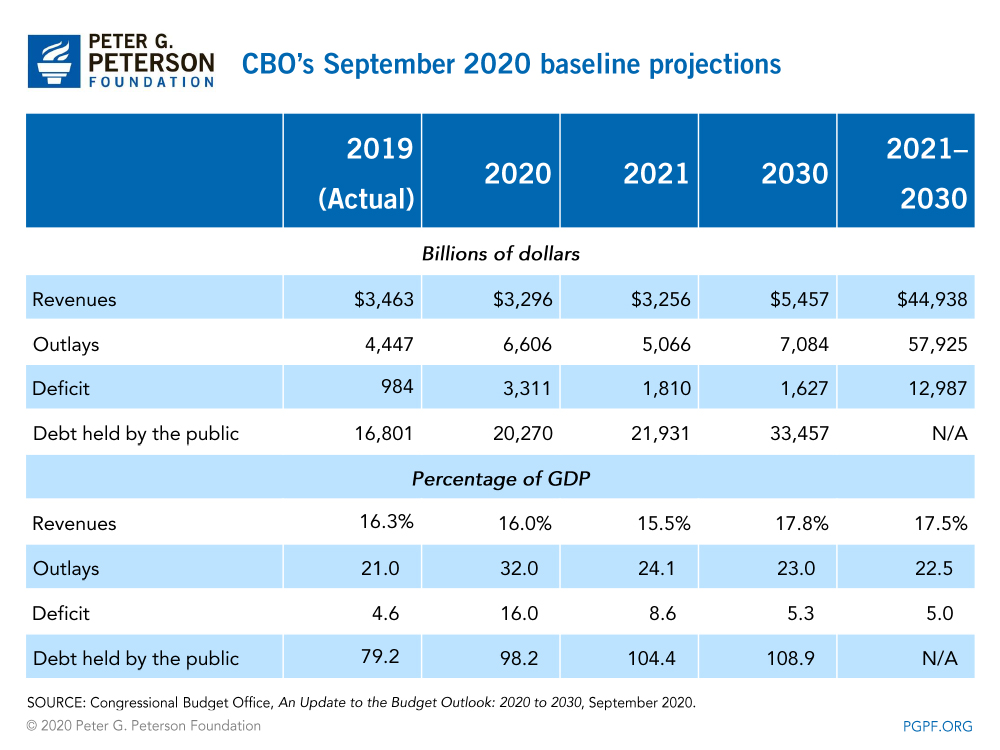
The budget outlook released in early September by the Congressional Budget Office (CBO) is the first to fully capture the budgetary impact of the coronavirus (COVID-19) pandemic and the federal legislation enacted in response to it. CBO’s projections show that the national debt has climbed sharply since earlier this year and will continue to grow over the 10-year projection period (from 2021 to 2030). Among the findings in the report:
- The federal budget deficit will total $3.3 trillion in 2020, which is equivalent to 16 percent of gross domestic product (GDP). That total is $2.3 trillion more than the agency estimated in January and more than triple the deficit recorded in 2019. CBO projects that the deficit will decline over the next four years, but will remain over $1 trillion annually through the 10-year period.
- Debt held by the public will roughly equal the size of the economy by the end of 2020. In 2023, the debt as a percentage of GDP would exceed its previous record, which occurred right after World War II.
- Over the 2020-2030 period, CBO projects that we will borrow $16.7 trillion. That is $2 trillion higher than projections for the same period made in January.
- In 2020, outlays will equal 32 percent of GDP, approximately 50 percent greater than what they were in 2019. Outlays would then fall as pandemic-related spending decreases, but will then resume their upward trajectory, reaching 23 percent of GDP in 2030. CBO projects revenues to fall from 16.3 percent of GDP in 2019 to 15.5 percent in 2021, primarily because of the economic disruption caused by the pandemic and the legislative response to it. By 2030, revenues will recover somewhat and reach 17.8 percent of GDP, well below the level of spending.
- CBO’s report significantly decreased its projections for interest costs in the budget, though those costs still comprise a significant part of spending. Interest costs will total $3.7 trillion over the next 10 years.
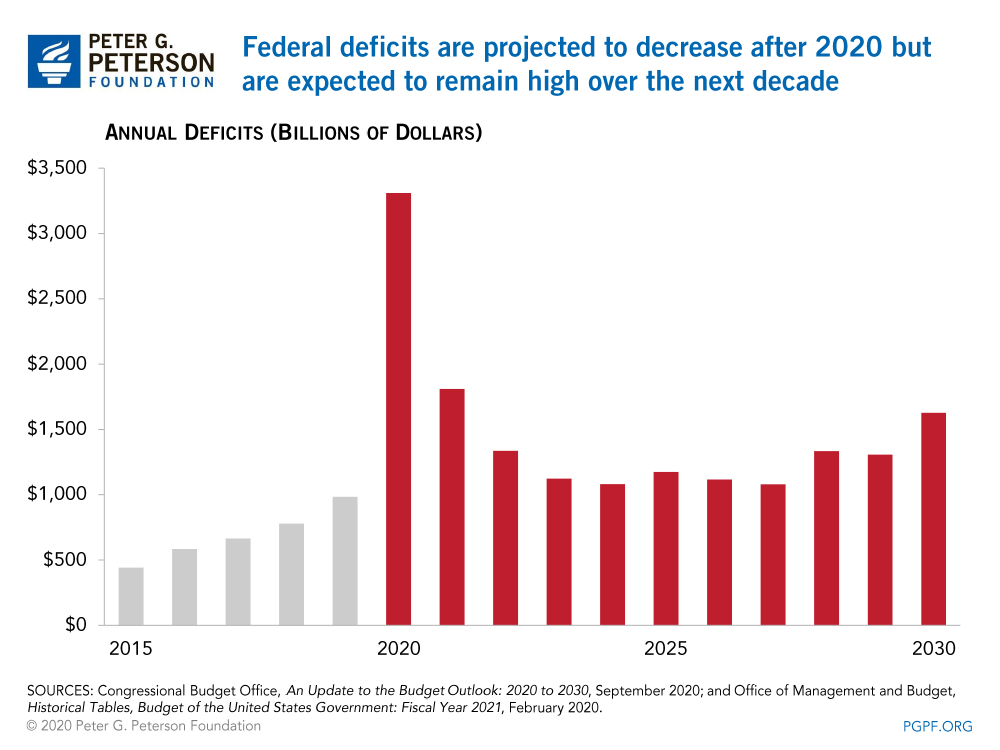
The Federal Deficit Will Be Over $1 Trillion Every Year Through 2030
CBO projects that the federal deficit will grow significantly in 2020 and remain high over the next decade. The deficit will reach $3.3 trillion in 2020, or 16 percent of GDP. In 2021, the deficit is projected to drop considerably but remain high at nearly 9 percent of GDP. By 2023, the deficit would decline to 4.9 percent as pandemic-related spending decreases and the economy improves.
Over the 10-year period, CBO reports that deficits will average 5.1 percent of GDP, much greater than the 3.0 percent average over the past 50 years. CBO estimates that the deficit will exceed $1 trillion in each of the next 10 years and total $13 trillion during that time, which is nearly 60 percent higher than the deficits accumulated in the decade after the Great Recession.
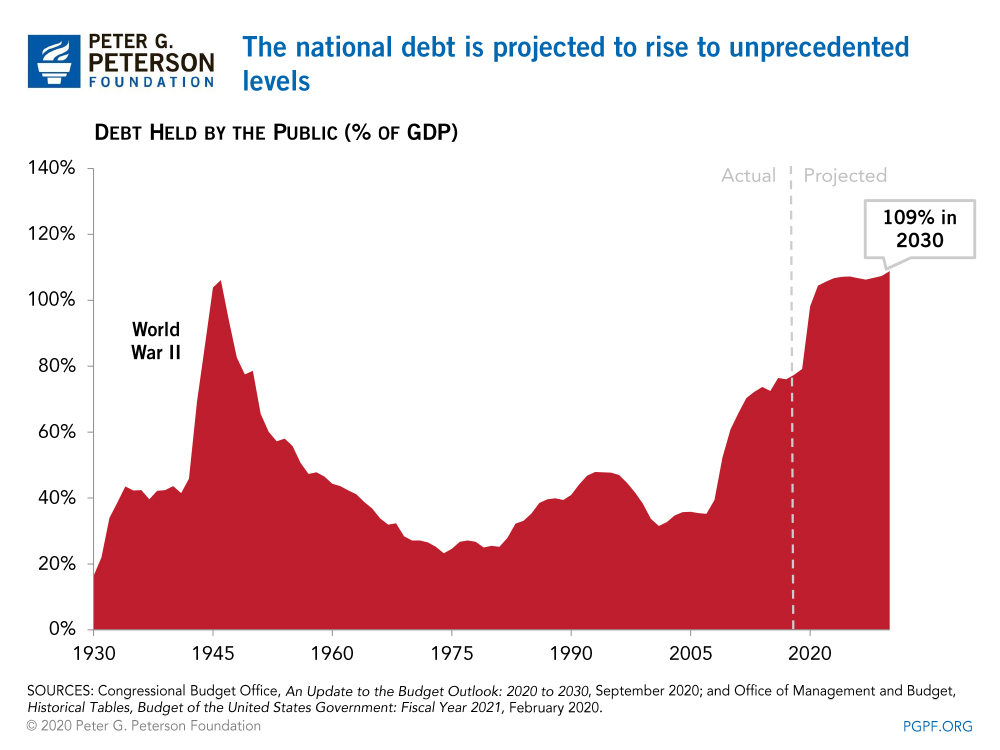
The National Debt Will Soon Surpass the Size of the U.S. Economy
CBO projects that debt held by the public will reach 98.2 percent of GDP by the end of this fiscal year, which would be the highest level since immediately after World War II. Much of the rapid growth in debt is attributable to the legislation enacted in response to the pandemic, though debt and deficits were high and rising even before the current crisis. By 2023, debt held by the public is projected to reach 107 percent of GDP, which would be the highest ratio ever recorded in the United States. CBO anticipates that debt will continue to gradually rise to 109 percent by 2030. Debt held by the public is estimated to nearly double from $16.8 trillion at the end of 2019 to $33.4 trillion at the end of 2030.
Federal Outlays Have Sharply Increased in 2020, Will Decline Next Year, But Remain High Through 2030
As a result of the pandemic and the legislative response to it, federal outlays spiked from 21 percent of GDP in 2019 to 32 percent in 2020. Outlays would then to fall as pandemic-related spending decreases, but would resume their upward trajectory by mid-decade and remain above the 50-year average of 20.4 percent through 2030. At that point, outlays are projected to be 23 percent of GDP, significantly higher than projected revenues.
Mandatory Spending Will Continue to Grow in the Longer-Term
Most of the increase in outlays in 2020 stem from mandatory programs — both existing safety net programs such as unemployment insurance as well as newly created programs to address the pandemic. CBO estimates that mandatory spending will reach about 22.4 percent of GDP (or $4.6 trillion) — up from 12.9 percent in 2019. Under current law, such spending would decline sharply in 2021 to 15.2 percent of GDP and remain greater than the 50-year average of 10.1 percent through 2030. In the near term:
- Income Security Programs: Spending for income security programs falls from 5.5 percent of GDP in 2020 and to less than 2 percent in 2022. In 2020, such spending will be driven by the direct payments to individuals and an increase in unemployment compensation, in part from the creation of three new programs: Federal Pandemic Unemployment Compensation, Pandemic Unemployment Assistance, and Pandemic Emergency Unemployment Compensation.
- Other programs to address COVID-19: Programs enacted in response to the pandemic, including the Paycheck Protection Program and the Coronavirus Relief Fund, added substantially to the deficit in 2020. The Paycheck Protection Program and other programs run by the Small Business Administration are expected to cost $577 billion this year; the Coronavirus Relief Fund has spent $150 billion. Neither of those programs are expected to add to the deficit next year.
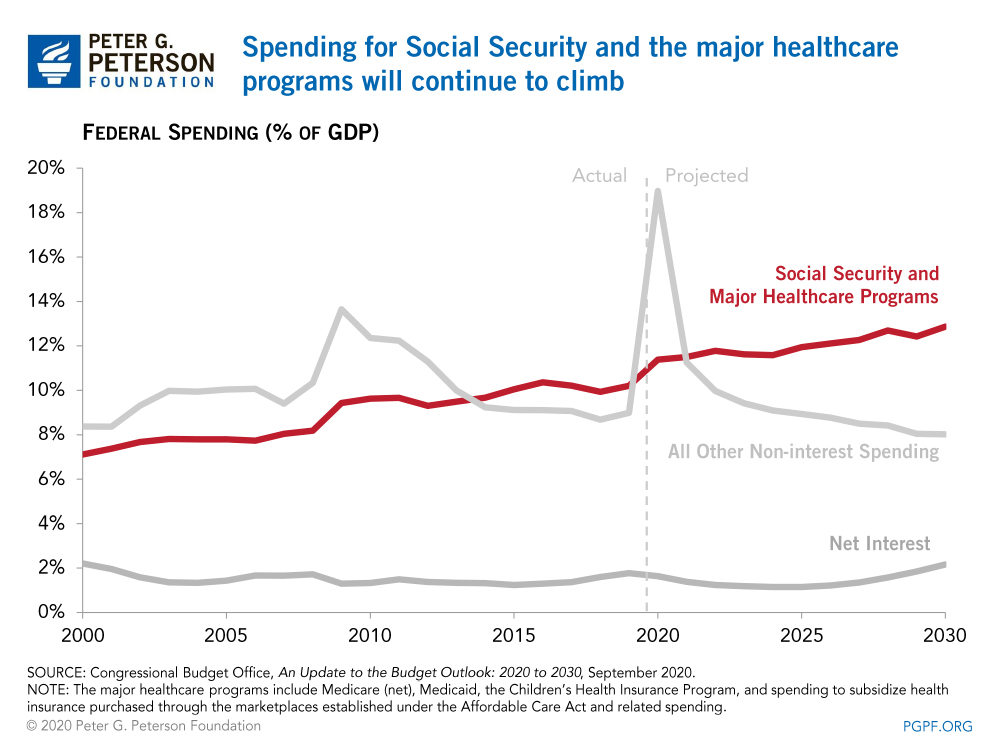
By 2024, mandatory spending would fall to 14.2 percent of GDP. Such spending then begins to grow and is projected to reach 15.1 percent of GDP (or $4.7 trillion) by 2030. In addition to mounting interest payments, growth in mandatory spending through 2030 is mainly driven by Social Security and major healthcare programs due to the aging of the population and rising healthcare costs.
- Social Security: Spending for the largest federal program would grow by around 5 percent over the decade, climbing from 5.3 percent of GDP in 2020 to nearly 6.0 percent in 2030.
- Major Healthcare Programs: Spending for major healthcare programs would increase from 6.1 percent of GDP in 2020 to 6.9 percent in 2030. That growth is driven by spending on Medicare, which is projected to grow from 57 percent of healthcare spending in 2020 to 62 percent by 2030 and reach 4.3 percent of GDP.
Discretionary Spending Spiked in 2020 But Will Decline in Later Years
Discretionary spending will increase significantly in 2020, growing from 6.3 percent of GDP in 2019 to 8.0 percent in 2020. That growth is attributable to non-defense spending from emergency appropriations related to the pandemic. Total discretionary spending however, is projected to decline in each of the subsequent years and average 6.4 percent of GDP through 2030, lower than the 8.3 percent average of the past 50 years.
Net Interest Payments Will Double By 2030
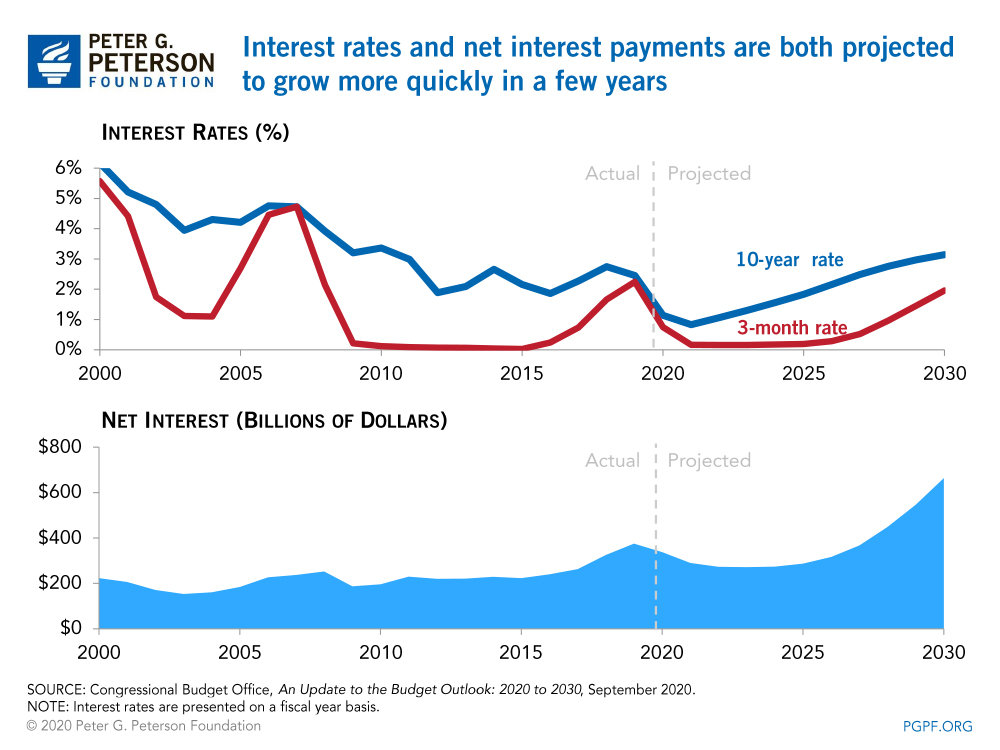
CBO projects that net interest costs will total $338 billion this year and nearly double by 2030. As the economy recovers and interest rates rise, interest payments will grow to 2.2 percent of GDP by 2030. Despite the fact that interest rates are relatively low, our large and growing debt means that interest costs remain a significant factor in America’s fiscal outlook.
The Pandemic Diminished Revenues But They Are Projected to Rebound as the Economy Improves
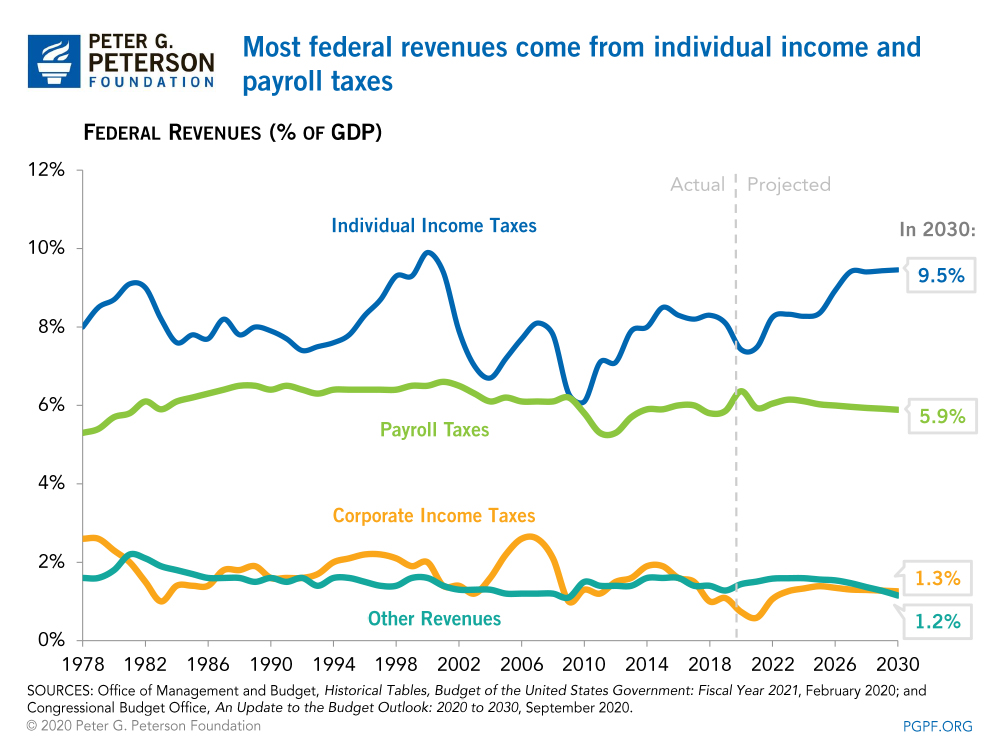
Revenues are projected to decline in the next couple of years and then modestly increase, averaging 17.6 percent of GDP through 2030. The initial decline in revenues stems from lower collections of individual and corporate income taxes in the second half of 2020, which CBO projects will be 13 percent lower than over the same period last year.
Beginning in 2022, CBO projects revenues to grow modestly, reaching 18.1 percent of GDP by 2027, but subsequently decline to 17.8 percent by 2030, just above the 50-year average of 17.4 percent. That pattern is primarily driven by increased collections from individual income taxes, which will climb from 7.4 percent of GDP in 2020 to 9.5 percent in 2030; those projections assume that tax cuts implemented in 2017 will expire as scheduled at the end of 2025. Other revenue sources combined dip to 8 percent of GDP in 2021 and rebound to 9 percent through 2025; however, such revenue sources are projected to decline to 8.3 percent of GDP in 2030.
Changes in Projections Since March
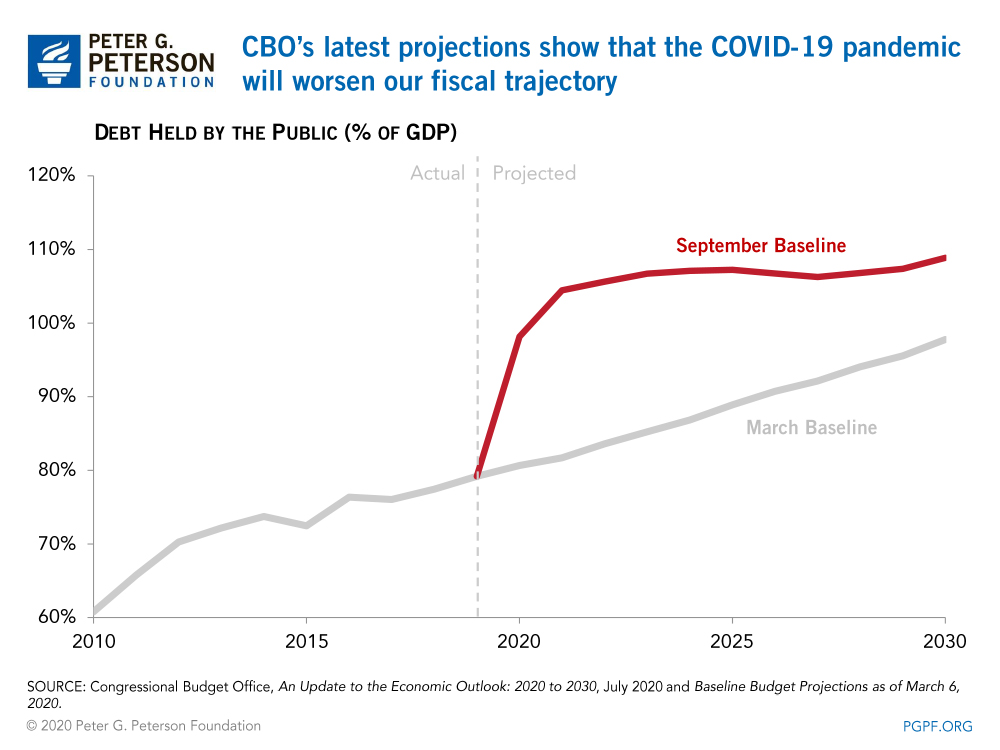
The pandemic and the cost of the legislation enacted in response to it has drastically changed elements of the budgetary outlook relative to CBO’s projections released in March. The deficit for 2020 is now anticipated to total $3.3 trillion — $2.3 trillion more than the estimate of $1.0 trillion made just several months ago. As a result, debt held by the public (measured as a percent of GDP) at the end of this year will be around 17 percentage points higher than the March projection and nearly the size of the entire U.S. economy.
In contrast, deficits for the 2021-2030 period will be about $108 billion lower. The pandemic and legislative effects increased projected primary deficits (which exclude net interest costs) by $2.1 trillion over that period; much of that change stems from a projection of lower revenues because of effects of the pandemic on the economy. However, those increased primary deficits are more than offset by a cumulative reduction in interest costs of $2.2 trillion that result from assumptions of lower interest rates than previously projected. Nevertheless, because of the spike in debt in 2020, debt held by the public is projected to reach $33.4 trillion in 2030, over $2.0 trillion higher than estimated in March.
Economic Outlook
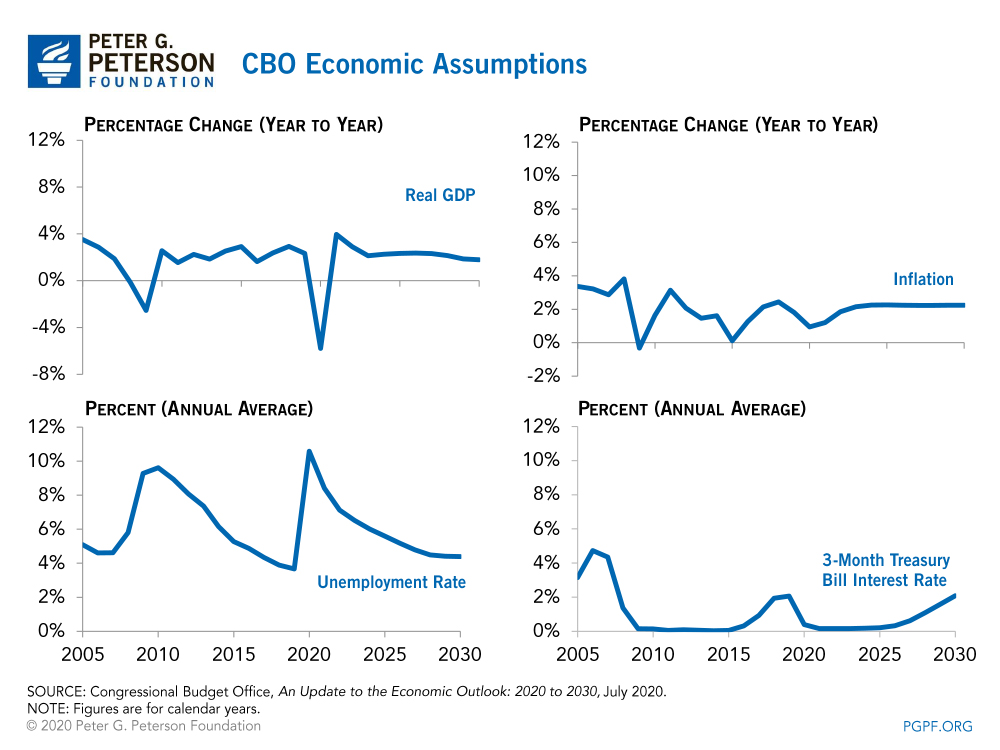
CBO’s economic forecasts are dependent on four key economic variables: GDP, the unemployment rate, interest rates, and inflation. Real (inflation-adjusted) GDP has taken a hit in 2020 and is estimated to decline by 5.8 percent this calendar year. The economy is expected to rebound next year, growing by nearly 4 percent in CBO’s projections. CBO expects growth to subsequently slow down and average 2.2 percent through 2030, falling below 2 percent in the last years of the 10-year projection period.
The pandemic has also caused many workers to lose their jobs; the unemployment rate spiked to 14.7 percent in April and is projected to average 10.6 percent for the calendar year. For 2021, the unemployment rate is forecasted to average 8.4 percent and is projected to decline further as the economy improves, averaging 5.7 percent through the 10-year period. Interest rates have sharply declined in 2020 and are projected to remain low through 2025, but then increase to pre-pandemic levels by 2030. Inflation is expected to slow through 2021 to an average of 1.1 percent per year; however, it is projected to then increase in 2022 and level off at an average of 2.2 percent through 2030.
Key Drivers of Debt Existed Before the Pandemic
The latest CBO projections reflect the impact that the coronavirus pandemic is having on the federal budget — due to both increased spending and decreased economic output. It also underscores the fact that prior to the pandemic, we were already on an unsustainable fiscal path due to structural and demographic factors, which will continue. Once we are able to overcome the damaging effects of the pandemic, lawmakers will need to return to addressing our fiscal challenges to ensure a future with greater preparedness and prosperity for the next generation.
Photo by Drew Angerer/Getty Images
Further Reading
What’s the Difference Between the Trade Deficit and Budget Deficit?
The terms “budget deficit” and “trade deficit” can be conflated, but they are distinct measurements of important fiscal and economic concepts.
The Federal Government Has Borrowed Trillions. Who Owns All that Debt?
Most federal debt is owed to domestic holders, but foreign ownership is much higher now than it was about 50 years ago.
The Fed Reduced the Short-Term Rate Again, but Interest Costs Remain High
High interest rates on U.S. Treasury securities increase the federal government’s borrowing costs.


