Ten Charts That Sum Up This Year in Fiscal News

A key part of our mission at the Peterson Foundation is to help explain and illustrate the nature of the country’s fiscal challenges. The issues we covered this year ranged from topics covered in the news — like the tax legislation — to explainers on important federal programs, like the Children’s Health Insurance Program (CHIP) and Medicaid. Below you’ll find some of the charts from our 2017 coverage. If you’d like to browse more, check out our Chart Archive.
The tax bill that was recently passed by Congress dominated the news cycle for a significant portion of 2017:
1. The national debt is much higher now than it was during the consideration of other major tax legislation. Generally speaking, the United States was in a much stronger fiscal position when lawmakers enacted major tax changes in recent history. The tax system was last overhauled in 1986, when a bipartisan group of lawmakers reformed and simplified the code. In 1986, the national debt was at 38 percent of GDP — approximately half of what it is today. In 2001 and 2003, significant tax cuts were enacted; as in 1986, the fiscal outlook during the time of those tax cuts was much more favorable than it is now.

2. The recently-passed tax legislation will add significantly to our debt. Given the size of projected deficits under current law, there is a considerable risk in pushing debt even higher. Adding to the debt could harm the economy by crowding out public and private investment, reducing our fiscal flexibility, and lowering confidence and certainty.

Now that tax legislation has passed, the Congress is turning its attention to funding the government.
3. This year, lawmakers have passed three continuing resolutions. While such temporary funding has avoided a government shutdown in the short term, continuing resolutions reflect the failure of lawmakers to reach agreement on appropriations for the full 2018 fiscal year, which began on October 1, 2017. Funding the government for a full year is preferable to using a CR because it allows government agencies to plan appropriately and match their resources with their responsibilities. That predictability in turn benefits the economy by providing certainty about government actions.

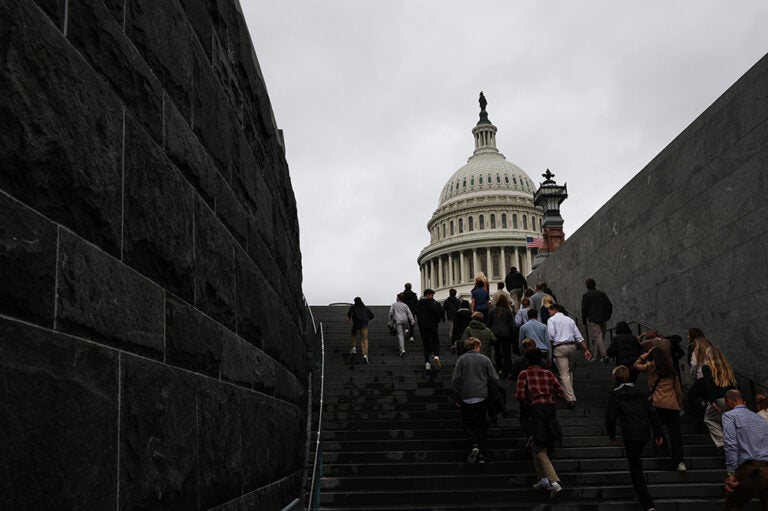
Another major issue in the news this year was the debt limit:
4. In March and again on December 9, the suspension of the statutory debt limit expired and the limit was reinstated. Beginning at those points, the Treasury Department was no longer able to borrow additional funds under standard operating procedures; instead, it began to employ “extraordinary measures.”

Financing for the Children’s Health Insurance Program continues to be subject to significant uncertainty. Short-term federal funding for the program has only been provided through March 31.
5. As states’ funding for the program begins to be exhausted, 1.1 million children could lose health coverage.

6. The percentage of children without health insurance has declined significantly since CHIP was created. CHIP was created in 1997 and covers children in families that are not eligible for Medicaid, but still have difficulty purchasing health insurance. Nationally, the program covers 8.9 million children, as well as over 300,000 pregnant women. Since the program was enacted 20 years ago, the percentage of uninsured children has dropped from 14 percent to 5 percent.

We also produced explainers on programs in the federal budget and other fiscal issues. This summer, we discussed some of the little known facts about Medicaid and the Supplemental Nutrition Assistance Program (SNAP):
7. 65 percent of Medicaid spending is directed towards the elderly and the disabled. Children, while making up nearly half of the beneficiaries, only account for approximately 20 percent of program spending.

8. SNAP is a wide-reaching program that provides support to many individuals and households across geographical boundaries. About 14 percent of all Americans participate in SNAP, while nearly two-thirds of all SNAP beneficiaries are children, elderly, or disabled.

2017 did not bring about forward movement on our country’s fiscal situation. The Congressional Budget Office warned that America faces serious budgetary challenges that threaten our future economy through reduced investment and decreases in family income.
9. As spending on mandatory programs and interest costs continues to rise, federal spending on discretionary programs will decline from 6.3 percent of GDP in 2017 to 5.4 percent in 2027. This would be a historically low level of discretionary spending — 25 percent below its 20-year historical average. Discretionary spending funds a wide range of activities including defense, education, research and development, infrastructure funding, and a variety of other programs.

10. Absent reforms, our growing debt will have serious and far-reaching economic consequences for American families. CBO warned that these levels of debt:
"…would reduce national saving and income in the long term; increase the government’s interest costs, putting more pressure on the rest of the budget; limit lawmakers’ ability to respond to unforeseen events; and increase the likelihood of a fiscal crisis, an occurrence in which investors become unwilling to finance a government’s borrowing unless they are compensated with very high interest rates.”

Image credit: Getty Images
Further Reading
National Debt Projected to Hit 175% GDP; Interest Totals $99 Trillion
Compared with the previous 30-year projections, spending will be higher, revenues lower, interest rates and interest payments elevated, and the national debt significantly larger.

Federal Healthcare Costs on Track to Reach $3.1 Trillion by 2036
Federal healthcare programs are among the fastest-growing drivers of federal spending, and their continued growth will put significant upward pressure on the national debt.
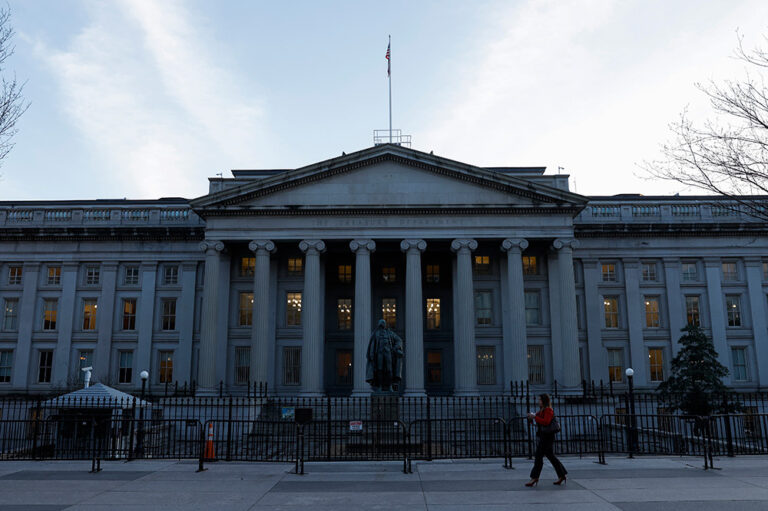
Quarterly Treasury Refunding Statement: Higher Borrowing Compared to Last Year
Key highlights from the most recent Quarterly Refunding include an increase in anticipated borrowing of $249 billion compared to the same period in the previous year.