The benefits from tax breaks do not flow equally to households of different income levels, according to a recent Congressional Budget Office (CBO) report. Here’s a quick look at the distributional effects of the tax expenditures that were included in CBO’s analysis.
What Are Tax Expenditures?
Tax expenditures, commonly called tax breaks, are written into the U.S. tax code and provide financial assistance for specific activities, entities, or groups of people. They contribute to the budget deficit, affect the distribution of income, and influence the economy by changing how people work, save, and invest. CBO’s report places tax expenditures into one of four categories:
- Exclusions are when income from certain sources is excluded from taxable income.
- Deductions allow taxpayers to reduce their taxable income by amounts that they have spent on specific purposes.
- Tax credits reduce tax liability dollar for dollar by the amount of the credit, and in the case of refundable credits, any remainder can be paid out to the taxpayer.
- Net preferential tax rates are when a rate is charged on certain sources of income that is lower than the ordinary tax rate.
Tax Expenditures Cost the Federal Government $1.6 Trillion in 2019
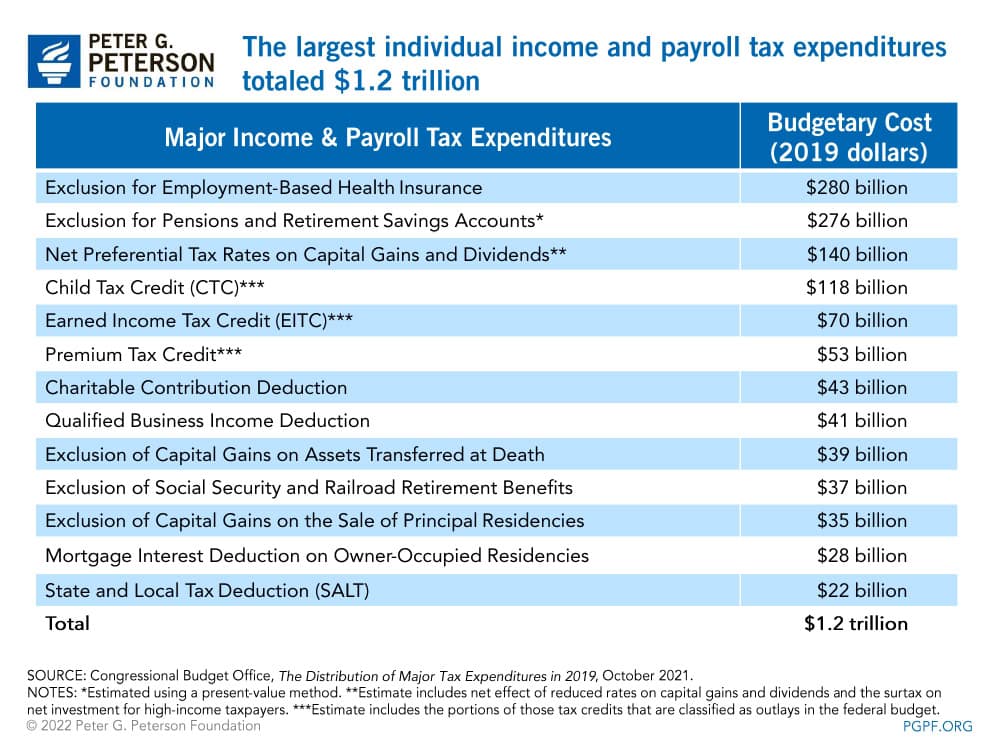
Tax expenditures cause the federal government’s revenues to be lower than they would have been otherwise. While CBO notes that overall tax expenditures amounted to $1.6 trillion in 2019, the latest CBO report focuses on the distributional effects of a $1.2 trillion subset of tax expenditures in the individual income and payroll tax systems. In other words, CBO’s distributional analysis excludes corporate income tax expenditures and some minor individual income and payroll tax expenditures.
Of the $1.2 trillion of tax expenditures analyzed in CBO’s report, those for the individual income tax totaled $1.0 trillion and those affecting payroll taxes accounted for $0.2 trillion. The two tax expenditures that affect payroll taxes are exclusions for health insurance and for pension and retirement accounts. Some of the biggest tax breaks applied to individual income taxes also include those affecting payroll taxes as well as reduced tax rates on dividends and long-term capital gains, the child tax credit, and the earned income tax credit.

Tax Expenditures Tend to Benefit Wealthier Taxpayers
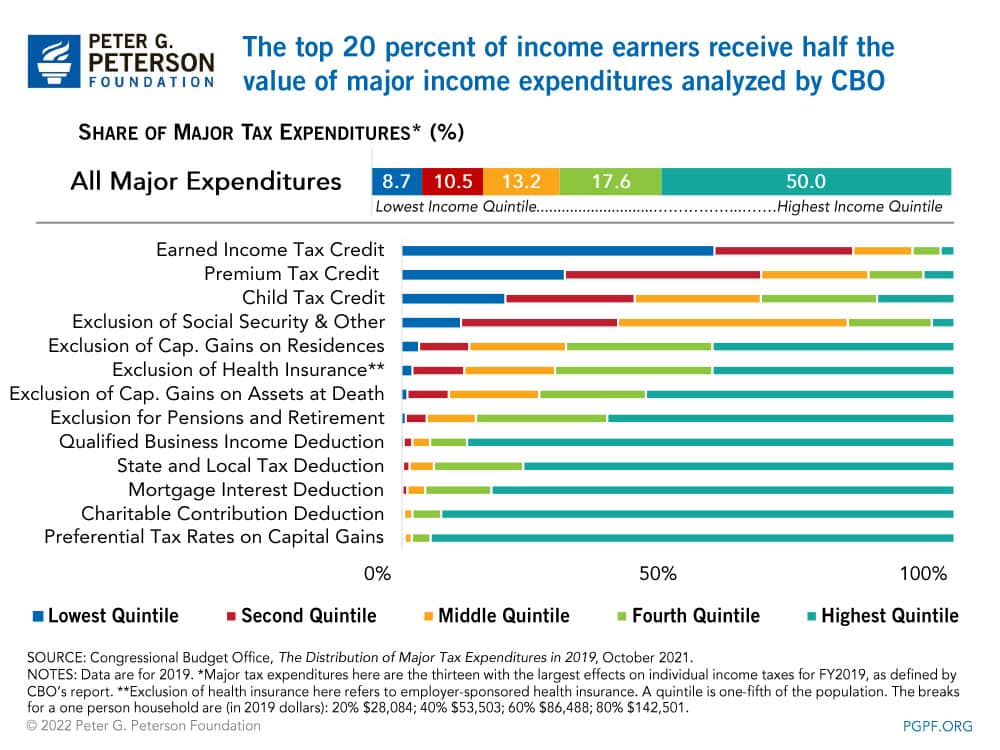
Each individual income tax expenditure distributes benefits across income groups differently. For example, households in the lower income quintiles receive most of their benefits from the earned income tax credit and child tax credit. By contrast, those in the higher income quintiles receive most of their benefits from the exclusion for pensions and retirement savings accounts and from the preferential rates on capital gains and dividends.

Lower Income Households Receive More Benefits as a Share of Total Income
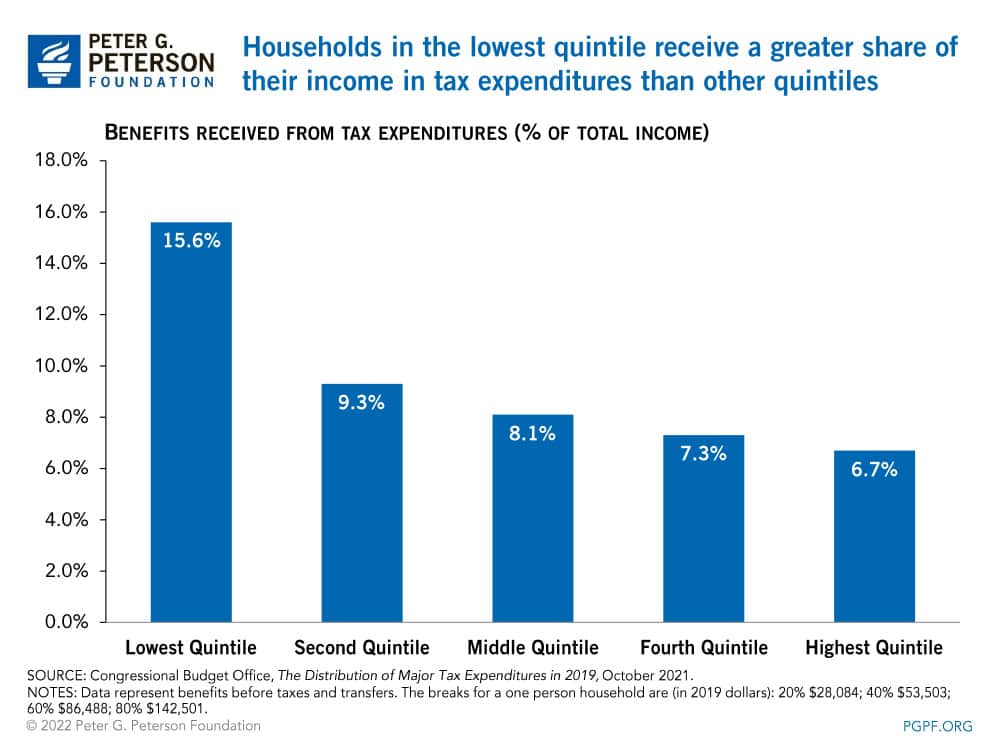
Overall, higher-income households enjoy greater benefits, in dollar terms, from the major income and payroll tax expenditures. In 2019, the highest earning 20 percent of households received about half of the benefit of the major tax expenditures, while the lowest earning 20 percent of households received just under 10 percent. However, the comparison flips when the benefits are measured as a share of income. Households in the lowest quintile received benefits equal to 16 percent of their total income before taxes and transfers; meanwhile, the benefit for those in the highest quintile was about 7 percent of income.

Conclusion
With the national debt at $30 trillion and counting, lawmakers will have to make important decisions about spending and revenues. One important component of those policy discussions will be the distributional impacts of changing tax expenditures. The more lawmakers understand those impacts, the better they can tailor fiscal policy to preserve important programs for the future while minimizing the burden felt by financially vulnerable Americans.
Image credit: John Coletti/Getty Images
Further Reading
What Are Refundable Tax Credits?
The cost of refundable tax credits has grown over the past several years, with the number and budgetary impact of the credits increasing.
Understanding the New Senior Deduction in the One Big Beautiful Bill Act
The senior deduction adds complexity to the tax code, and fewer than half of seniors will benefit from it.
What Are Estate and Gift Taxes and How Do They Work?
Estate and gift taxes produce relatively lower revenue compared to other sources, but they generate a significant amount of attention, and even controversy.


