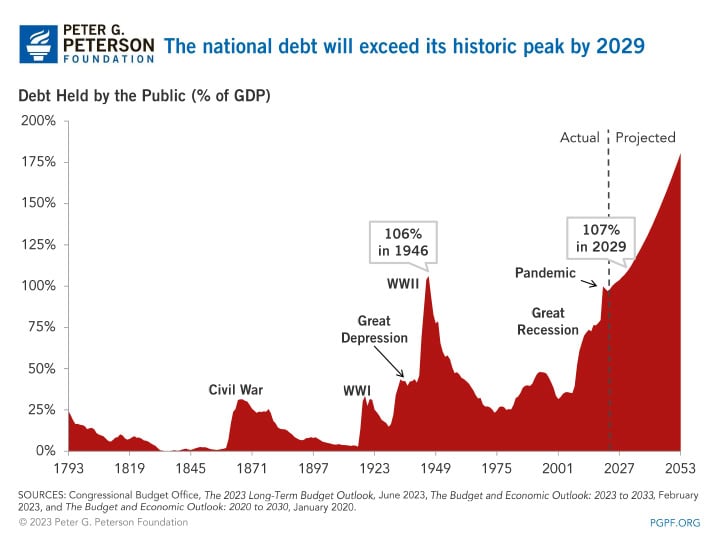
In around six years, the national debt will likely exceed its all-time high of 106 percent of gross domestic product (GDP), which occurred in 1946, the year immediately following the end of World War II. Historically, high levels of national debt in relation to GDP resulted from periods of war or economic downturn, such as the Civil War, Great Depression, and World War II, and then receded afterward. In contrast, the federal government’s relationship with debt is now very different. While resources provided to combat the COVID-19 pandemic further accelerated the accumulation of debt, the United States already had an unsustainable fiscal outlook rooted in a fundamental imbalance between spending and revenues. Here, we examine the fundamental difference between the fiscal outlook after World War II and now, and why — despite similar levels of debt — the fiscal outlook now is much worse than it was in 1946. Two major factors explain the difference in the fiscal outlook now: expectations of lower economic growth and the underlying structural imbalance in the federal budget.
How Has the U.S. Fiscal Outlook Changed since World War II?
From the end of World War II to today, the economic and fiscal condition of the United States can be divided into three general periods:
- The strong economic growth immediately after the war through 1980
- The stable yet slowing growth from 1981 to 2008
- The economically turbulent period between 2009 and 2022
Fiscal and Economic Conditions from Post-War to 1980
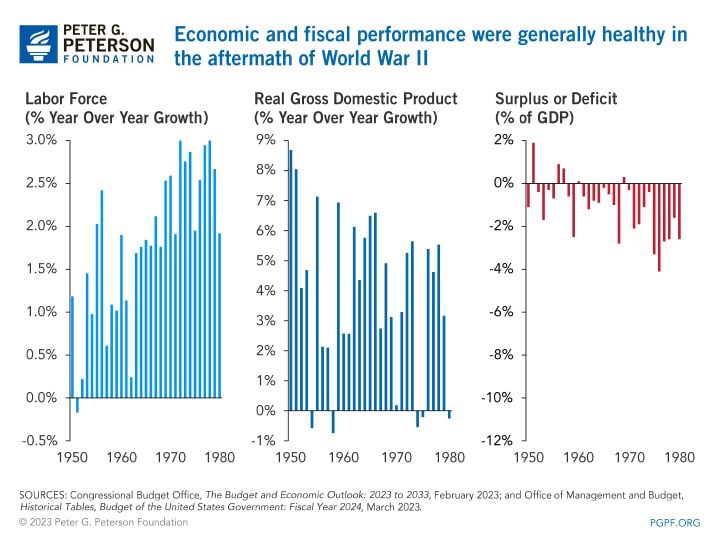
During the war, spending far exceeded revenues. Between 1942 and 1945, an average of 84 percent of the federal budget was allocated to national defense. After the war, defense spending (adjusted for inflation) was drastically reduced from $1.1 trillion in 1945 to $177 billion in 1950. As a result, the federal government was able to reestablish a closer balance between spending and revenues by 1950. That balance was mostly maintained over the next 30 years, resulting in an average deficit of only 1.1 percent of GDP. The nation also invested more in programs for education, healthcare, income security, and Social Security over that period, increasing such outlays from $135 billion in 1950 to $829 billion in 1980. Over the same time, the civilian labor force grew by 72 percent, from 62 million people to 107 million. Those factors contributed to the economic boom of the post-war period during which real GDP nearly tripled.
Fiscal and Economic Conditions from 1981 to 2008
America’s fiscal outlook began to change in the 1980s during a period of slowing economic growth and high deficits. That period began with the recession of 1981–82, which prior to the financial crisis starting in 2008, was the largest economic downturn in the United States since the Great Depression. While the next few decades still showed strong growth in real GDP, that growth was significantly slower than the post-war period. Average yearly growth in real GDP was 3.1 percent from 1981 to 2008, about 1 percentage point less than that from 1950 to 1980. Federal deficits also grew during that time to an average of 2.5 percent of GDP. However, the annual balance varied widely, from a deficit of 5.9 percent of GDP in 1983 to a surplus of 2.3 percent of GDP in 2000.
Fiscal and Economic Conditions from 2009 to 2022
Over roughly the past decade, the United States has faced great economic and social challenges that contributed to the difficult fiscal outlook. Federal deficits grew during this period as the government responded to the economic turmoil associated with the financial crisis and the COVID-19 pandemic. While federal receipts were reduced by fiscal policies like the Tax Cuts and Jobs Act and economic decline in 2009 and 2020, outlays grew from fiscal stimulus and other economic support in response to the Great Recession and COVID-19 as well as from systemic factors like high healthcare costs, an aging population, and interest payments on the national debt. From 2009 to 2022, the federal government received 72₵ for every dollar it spent, equating to an average deficit of 6.5 percent of GDP. Real GDP also grew at a significantly slower rate than the previous two periods, at an average of 1.8 percent each year.
The U.S. Fiscal Outlook Now
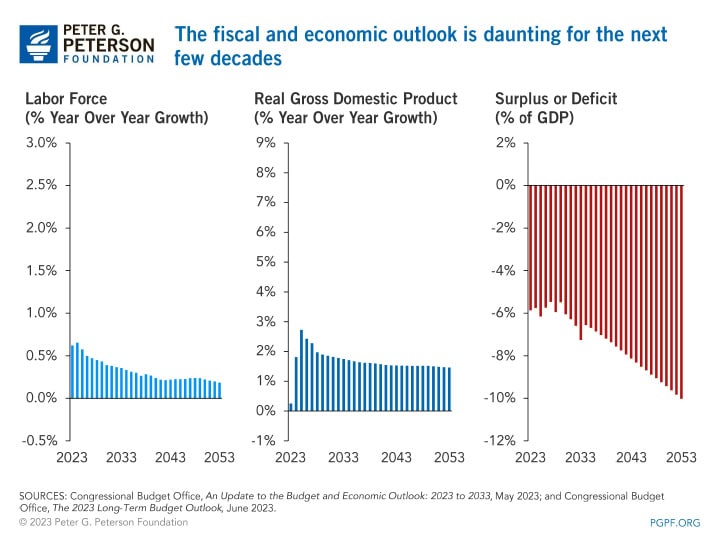
Looking forward, slower growth in GDP as well as the fiscal imbalance between spending and revenues has set forth a much more challenging fiscal outlook. Those challenges will be more difficult to address than they were after World War II. The Congressional Budget Office (CBO) projects that the labor force will only grow at an average annual rate of 0.3 percent over the next 30 years, from 165 million people in 2023 to 181 million in 2053. A slowly growing labor force holds back economic growth, contributing to a lower rate of real GDP growth, which is projected to average just 1.7 percent over that period.
In addition, annual deficits will grow over the next 30 years according to CBO. Deficits occur when federal spending exceeds revenues; over the long-term, persistent, large deficits indicate a structural imbalance within the federal budget. The federal deficit is projected to grow from 5.9 percent of GDP in 2023 to 10.0 percent in 2053. That outpaced spending combined with slower economic growth will make it more challenging to reduce the national debt in proportion to GDP in the future than it was in the decades following World War II.
Two Major Differences between the Post-War Period and the Current Outlook
Below is a deeper dive into the two major areas that contributed to the disparate fiscal outlooks: economic growth and the balance between federal spending and revenues.
Economic Growth Is Significantly Slower Now
In the years following World War II, GDP increased at a faster rate than the national debt, and along with generally responsible fiscal policies, led to a reduction in debt-to-GDP most years through 1974. The United States experienced tremendous economic growth from 1950 to 1980 that was fueled by a boom in consumer spending, a quickly growing labor force, and increasing worker productivity. In total, real GDP nearly tripled, from $2.3 trillion in 1950 to $6.8 trillion in 1980.
In contrast to that period, the economic outlook for the next three decades anticipates economic growth, but that growth will not be enough to match the growth of the national debt. Over the next thirty years, real GDP is projected to grow by 66 percent, about a third as much as the period after the war. Much of the difference in economic growth between the few decades following World War II and the current 30-year outlook results from slower anticipated growth in the labor force. Slower growth in the labor force will constrain economic growth.
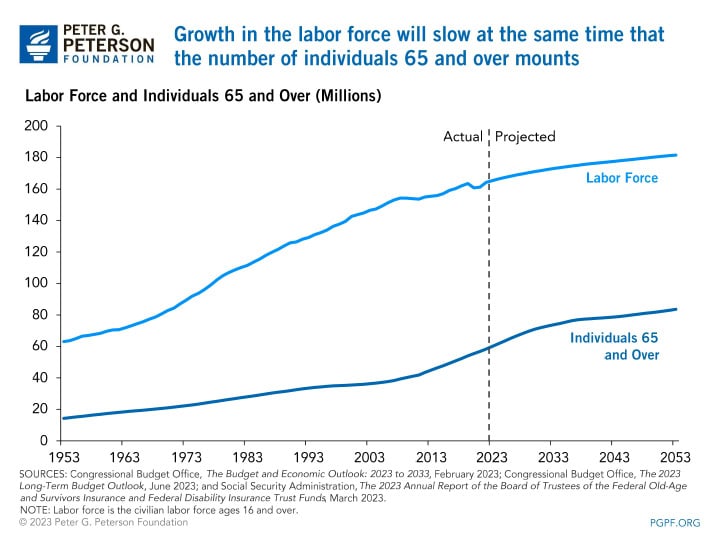
Historically, labor force growth — along with increasing labor productivity — has been a key component to economic growth as more workers typically means more production, more wages, and more consumption. From 1950 to 1980, the number of civilians age 16 and over increased 72 percent, from 62 million to 107 million. Additionally, labor force participation increased over roughly the same period as more women began working. That growth in the labor force spurred economic growth.
Today, labor force growth has slowed considerably. From 2023 and 2053, the labor force is expected to grow by only 10 percent (16 million workers). That slower growth is attributable to the aging of the population, as a greater share of the population will be beyond working age. Over the same period, the number of individuals age 65 and over will increase by 39 percent (24 million individuals).
Imbalance between Spending and Revenues Will Continue to Rise
Besides economic growth, the debt-to-GDP ratio can be reduced by limiting deficits. The spending that led to the historically high national debt in 1946 was driven by short-term deficit spending tied to the war. After the war, outlays as a share of GDP dropped by about half and remained at an average of 18 percent of GDP from 1950 to 1980. Over those same three decades, annual revenues averaged 17 percent of GDP, leading to an average deficit of only 1.1 percent of GDP.
Now, spending and revenues are severely mismatched, and spending is projected to continue to outpace revenues in the absence of intervention from lawmakers. From 2023 to 2053, annual revenues are projected to average 18 percent of GDP, while spending is projected to average 26 percent. That mismatch between revenues and spending will lead to an average deficit of 7.5 percent of GDP.
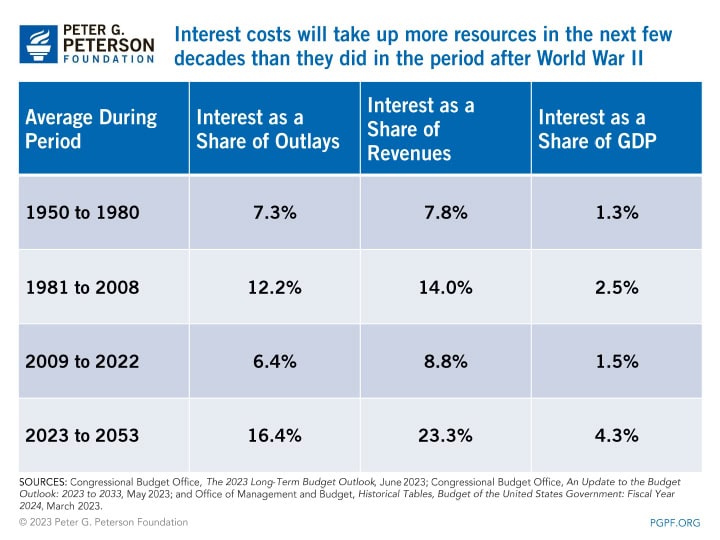
In particular, interest costs will be a key factor that drives up total spending — and therefore deficits and debt. That was not the case in the period following the Second World War, when interest costs remained relatively low. From 1950 to 1980, interest accounted for around 8 percent of revenues. However, as interest rates began to increase towards the end of that period, the share of revenues jumped up to a high of 18 percent. After the financial crisis, the Federal Reserve kept short-term rates low and long-term rates declined; as a result, interest as a share of revenues dropped back to the level seen in the 1950-1980 period. In addition, interest during those two periods averaged around 1.5 percent of GDP or slightly below.
In contrast, over the next three decades, rising debt and higher rates means that the federal government will need to devote more resources to paying interest. Measures of net interest costs are projected to be two to three times higher than the period immediately following World War II. For example, CBO projects that, on average, interest payments will account for nearly 25 percent of revenues through 2053. By the end of that period, interest would represent more than a third of revenues; as a percentage of GDP, it will be double the highest ratio to date (3.2 percent in 1991) and continue to grow.
Conclusion
The primary reason the fiscal outlook is worse than it was after World War II despite similar levels of debt is the effect of the structural mismatch between spending and revenues. There are a myriad of options available to lawmakers to reduce spending and increase revenues, as happened after World War II to drive down the national debt. A promising fiscal outlook makes the U.S. economy stronger and the nation more capable of facing the next set of challenges.
Image credit: Photo by Al Drago/Getty Images
Further Reading
What’s the Difference Between the Trade Deficit and Budget Deficit?
The terms “budget deficit” and “trade deficit” can be conflated, but they are distinct measurements of important fiscal and economic concepts.
The Federal Government Has Borrowed Trillions. Who Owns All that Debt?
Most federal debt is owed to domestic holders, but foreign ownership is much higher now than it was about 50 years ago.
The Fed Reduced the Short-Term Rate Again, but Interest Costs Remain High
High interest rates on U.S. Treasury securities increase the federal government’s borrowing costs.


