Peter G. Peterson Foundation May "Fiscal Confidence Index" Finds High Levels of Concern about Long-Term Debt Even as Near-Term Economic and Fiscal Indicators Show Signs of Progress
Peter G. Peterson Foundation May "Fiscal Confidence Index" Finds High Levels of Concern about Long-Term Debt Even as Near-Term Economic and Fiscal Indicators Show Signs of Progress

The May 2013 Fiscal Confidence Index, Modeled after the Consumer Confidence Index, is 47 (100 is Neutral), Indicating Strongly Negative Public Sentiment
Most Americans (73%) say Congress and the President should agree now on a long-term plan to deal with debt and build confidence in the economy
Voters overwhelmingly agree (82%) that at least some revenue from tax reform should be used to reduce debt and deficits
NEW YORK — Americans continue to show high levels of concern about our nation’s long-term debt, even as economic and near-term fiscal indicators show signs of improvement, according to the Peter G. Peterson Foundation’s latest Fiscal Confidence Index, a monthly measure of public attitudes about the nation’s long-term debt and the efforts elected leaders are making to address the debt.
The May 2013 Fiscal Confidence Index, modeled after the Consumer Confidence Index, is 47 (100 is neutral), indicating strongly negative public sentiment about America’s fiscal situation. Sentiment has remained consistently very negative since the launch of the Fiscal Confidence Index in December 2012.
“The May Fiscal Confidence Index shows that Americans continue to crave action from Congress and the Administration on our long-term debt,” said Michael A. Peterson, President and COO of the Peterson Foundation. “Americans understand that addressing the nation’s long-term debt gradually will help our economy in the short term and the long term. This survey shows that if Congress and the President demonstrate that they are willing to make smart compromises for our nation’s fiscal and economic future, American voters will support them.”
The Fiscal Confidence Index measures public opinion about the national debt by asking six questions in three key areas:
- CONCERN: Level of concern and views about the direction of the national debt.
- PRIORITY: How high a priority addressing the debt should be for elected leaders.
- EXPECTATIONS: Expectations about whether the debt situation will get better or worse in the next few years.
The survey results from these three areas are weighted equally and averaged to produce the Fiscal Confidence Index value. The Fiscal Confidence Index, like the Consumer Confidence Index, is indexed on a scale of 0 to 200, with a neutral midpoint of 100. A reading above 100 indicates positive sentiment. A reading below 100 indicates negative sentiment.
Fiscal Confidence Index Key Data Points: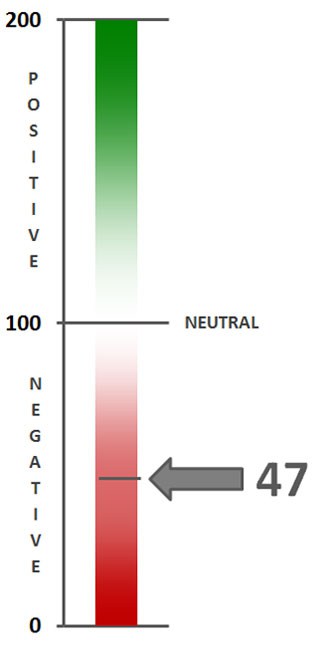
- The May 2013 Fiscal Confidence Index value is 47. A score of 100 is neutral. Values below 100 show negative sentiment, while values above 100 show positive sentiment. (April’s value was 44. March’s value was 46.)
- The current Fiscal Confidence Index score for CONCERN about the debt is 40, indicating strong concern about the debt. The score for debt as a PRIORITY that leaders must address is 23, indicating that Americans want elected leaders to make addressing long-term debt a high priority. The score for EXPECTATIONS about progress on the debt over the next few years is 77, indicating pessimism about the direction of long-term fiscal policy in the next few years. The Fiscal Confidence Index of 47 is the average of these three sub-category scores.
- May showed a very slight uptick in sentiment across all Fiscal Confidence Index and sub-category scores, however scores have remained consistently negative since the launch of the Index in December 2012.
- For a description of the complete methodology, see the Appendix below.
Americans Want Washington to Agree on a Long-Term Debt Plan to Help the Economy
As policymakers, economists, and the public discuss the connection between economic growth and long-term debt reduction, the Peterson Foundation asked Americans whether elected leaders should agree now on a plan to reduce long-term debt that can be implemented gradually as the economy recovers, or wait until the economy is stronger before agreeing on a plan.
- 73% said policymakers should agree on a plan now to address long-term debt (56% feel that way strongly), while 21% said policymakers should wait to develop a long-term plan until the economy is stronger.
- These figures are only slightly changed from February 2013, when 76% of respondents said policymakers should agree on a plan now and 18% said they should wait.
Americans Across Party Lines Believe Additional Revenue from Tax Reform Should Be Used to Reduce Debt and Deficits
With both parties in Washington looking at tax reform as a possible next step on fiscal policy, the Peterson Foundation polled Americans on whether additional revenue from trimming tax breaks should be used to reduce debt and deficits.
- 82% of Americans said some (56%) or all (26%) of the additional revenue should be used to reduce debt and deficits.
- Support for using new revenue to reduce debt and deficits was strong across party lines, with 75% of Republicans, 83% of Independents, and 88% of Democrats in agreement.
- A higher percentage of Republicans (33%) than Independents (28%) or Democrats (20%) said “all” of the additional revenue should be used to reduce debt and deficits.
The Peter G. Peterson Foundation commissioned the poll by the Global Strategy Group to survey public opinion on the national debt. The nationwide poll included 1,013 U.S. registered voters, surveyed by telephone between May 20 and May 22, 2013. The poll has a margin of error of +/- 3.1%. The poll examined voters’ opinions on the national debt, political leadership, and America’s fiscal and economic health.
Detailed poll results can be found online at: www.pgpf.org/what-we-are-doing/education-and-awareness/fiscal-confidence-index
About the Peter G. Peterson Foundation
The Peter G. Peterson Foundation is a nonprofit, nonpartisan organization established by Pete Peterson — businessman, philanthropist, and former U.S. Secretary of Commerce. The Foundation is dedicated to increasing public awareness of the nature and urgency of key long-term fiscal challenges threatening America’s future and to accelerating action on them. To address these challenges successfully, we work to bring Americans together to find and implement sensible, long-term solutions that transcend age, party lines and ideological divides in order to achieve real results. To learn more, please visit www.pgpf.org.
APPENDIX: Fiscal Confidence Index Methodology and Questions
- The Fiscal Confidence Index is released monthly by the Peter G. Peterson Foundation.
- The Fiscal Confidence Index value is based on six questions in three categories.
- As is done with the Consumer Confidence Index, the first step in calculating the Fiscal Confidence Index is determining the “Relative Value” for each question. This calculation is made by taking the positive response for each question and dividing it by the sum of the positive and negative responses. Each question was asked on a four-point scale, and answers were weighted according to intensity, with the strongest responses counting twice as much as the middle responses (“much” better or worse answers count twice as heavily as “somewhat” better or worse answers).
- The scores for the Concern, Priority, and Expectations categories are determined by averaging the scores derived from the two questions in each category.
- The Fiscal Confidence Index value is converted from the Relative Value to place it on a scale on which 100 indicates equal positive and negative sentiment, while values below 100 indicate negative sentiment and values above 100 indicate positive sentiment.
- The Peter G. Peterson Foundation commissioned a poll by the Global Strategy Group to survey public opinion on the national debt. The nationwide poll included 1,013 U.S. registered voters, surveyed by telephone between May 20 and May 22, 2013. The poll has a margin of error of +/- 3.1%. The poll examined voters’ opinions on the national debt, political leadership, and America’s fiscal and economic health.
- The questions are as follows:
| CONCERN (40) | ||||
|---|---|---|---|---|
| Thinking about our national debt over the last few years, would you say your level of concern has increased or decreased? ◊ Is that a lot or just a little? |
May 2013 | Apr. 2013 | Mar. 2013 | |
| Increased a lot | 54% | 52% | 58% | |
| Increased a little | 19% | 21% | 18% | |
| Decreased a little | 8% | 9% | 7% | |
| Decreased a lot | 4% | 4% | 5% | |
| (No change) | 14% | 13% | 11% | |
| (Don’t Know/Refused) | 1% | 1% | 1% | |
| INCREASED (NET) | 73% | 73% | 76% | |
| DECREASED (NET) | 12% | 13% | 11% | |
| When it comes to addressing our national debt, would you say things in the United States are heading in the right direction or do you think things are off on the wrong track? ◊ Do you feel that way strongly or just somewhat? |
May 2013 | Apr. 2013 | Mar. 2013 | |
| Right direction-Strongly | 13% | 8% | 13% | |
| Right direction-Somewhat | 17% | 21% | 19% | |
| Wrong track-Somewhat | 16% | 18% | 14% | |
| Wrong track-Strongly | 44% | 43% | 45% | |
| (Neither/Mixed) | 6% | 6% | 4% | |
| (Don’t Know/Refused) | 4% | 4% | 4% | |
| RIGHT DIRECTION (NET) | 30% | 29% | 33% | |
| WRONG TRACK (NET) | 60% | 61% | 60% | |
| PRIORITY (23) | ||||
|---|---|---|---|---|
| Some people say that addressing the national debt should be among the President and Congress’ top 3 priorities. Do you agree or disagree? ◊ Do you feel that way strongly or just somewhat? |
May 2013 | Apr. 2013 | Mar. 2013 | |
| Strongly agree | 61% | 64% | 68% | |
| Somewhat agree | 20% | 19% | 15% | |
| Somewhat disagree | 8% | 9% | 7% | |
| Strongly disagree | 7% | 5% | 7% | |
| (Don’t Know/Refused) | 4% | 3% | 4% | |
| AGREE (NET) | 81% | 83% | 83% | |
| DISAGREE (NET) | 15% | 14% | 13% | |
| And when it comes to our national debt, do you think it is an issue that the President and Congress should spend more time addressing or less time addressing? ◊ Would you say a lot (more or less) time or just a little? |
May 2013 | Apr. 2013 | Mar. 2013 | |
| A lot more time | 65% | 65% | 67% | |
| A little more time | 17% | 19% | 15% | |
| A little less time | 6% | 5% | 5% | |
| A lot less time | 5% | 3% | 5% | |
| (The same amount of time) | 4% | 4% | 4% | |
| (Don’t Know/Refused) | 3% | 4% | 3% | |
| MORE TIME (NET) | 82% | 84% | 84% | |
| LESS TIME (NET) | 11% | 8% | 10% | |
| EXPECTATIONS (77) | ||||
|---|---|---|---|---|
| And thinking about our national debt over the next few years, do you expect the problem to get better or worse? ◊ Is that much (better or worse) or just somewhat (better or worse)? |
May 2013 | Apr. 2013 | Mar. 2013 | |
| Much better | 10% | 8% | 10% | |
| Somewhat better | 20% | 21% | 21% | |
| Somewhat worse | 26% | 27% | 22% | |
| Much worse | 36% | 37% | 38% | |
| (No change) | 3% | 3% | 3% | |
| (Don’t know/Refused) | 4% | 5% | 6% | |
| BETTER (NET) | 31% | 29% | 31% | |
| WORSE (NET) | 63% | 64% | 60% | |
| And when it comes to our national debt, are you optimistic or pessimistic that the United States will be able to make progress on our national debt over the next few years? ◊ Would you say you are very (optimistic or pessimistic) or just somewhat? |
May 2013 | Apr. 2013 | Mar. 2013 | |
| Very optimistic | 20% | 18% | 22% | |
| Somewhat optimistic | 29% | 31% | 26% | |
| Somewhat pessimistic | 17% | 18% | 18% | |
| Very pessimistic | 29% | 28% | 30% | |
| (Neither/Mixed) | 3% | 2% | 3% | |
| (Don’t Know/Refused) | 2% | 2% | 2% | |
| OPTIMISTIC (NET) | 49% | 49% | 47% | |
| PESSIMISTIC (NET) | 46% | 46% | 48% | |
Further Reading

How Much Government Spending Goes to Children?
Interest costs on the national debt are expected to rapidly outstrip spending on children in coming years.

IRS Staffing Cuts Will Reduce Revenues, Driving Deficits Higher
Reductions in IRS personnel decrease federal revenues, increase deficits, and significantly exacerbate the gap between taxes that are owed and taxes that are actually paid.

What Is a Value-Added Tax and Should the United States Have One?
Almost all developed economies have a value-added or similar consumption tax — but the United States does not.