Since March 2020, federal policymakers have enacted six major pieces of legislation in response to COVID-19 — including the $2 trillion Coronavirus Aid, Relief, and Economic Security (CARES) Act, enacted on March 27, 2020, and the $1.9 trillion American Rescue Plan (ARP), enacted on March 11, 2021. All told, the six relief bills are expected to cost a total of $5.3 trillion and include funding for programs such as direct aid to governments, federal support for education, enhanced unemployment benefits, and much more.
In addition to evaluating the effectiveness of each program, policymakers and the public can assess the reach of that funding by comparing how much has gone to taxpayers, businesses, healthcare providers, and governments in each state. As would be expected, the largest states often received the largest disbursements within each program. However, the amount disbursed per capita can vary by state, with such variances depending on the specific COVID-19 relief program because each one includes a different set of criteria for how the money is allocated. Below we lay out some explanations for differences in total funding and funding per capita among states. Unless noted otherwise, these comparisons only reflect data through April 15, 2021.
Gross COVID Relief Funding by State
Generally, states with larger populations have been receiving more federal dollars from COVID-19 relief programs as such states typically have more unemployed persons, small businesses, and healthcare providers to which that relief has been targeted.
However, that trend can vary by program. For example, states that have higher unemployment levels may have received more employment-related relief relative to their population size. Hawaii ranks 40th in the nation in terms of population size, but the state ranks 5th in terms of per capita funding received through the federal programs that enhanced and expanded unemployment benefits. Likewise, Nevada ranks 32nd in the nation in terms of population size, but the state ranks 7th in terms of per capita funding received through such programs. Part of the reason those states received more funding was because much of their workforce was in the leisure and hospitality industry, which was disproportionally affected by the pandemic. Before the pandemic, jobs in that industry accounted for 21 percent of the workforce in Nevada and 17 percent in Hawaii — the average across all other states was about 9 percent.
The allocation methodology of each program also affects how much a state will receive. For example, much of the initial $50 billion distributed through the Provider Relief Fund may have benefited states with a higher number of large, financially sound healthcare providers, as that first wave of relief was based on providers’ share of 2018 net patient revenue. Hospitals in California, Florida, and Texas received the most funding from that disbursement. In general, support from the Provider Relief Fund was also targeted to COVID-19 hot-spots, rural hospitals, skilled nursing facilities, and other healthcare providers.
COVID Relief Funding Per Capita by State
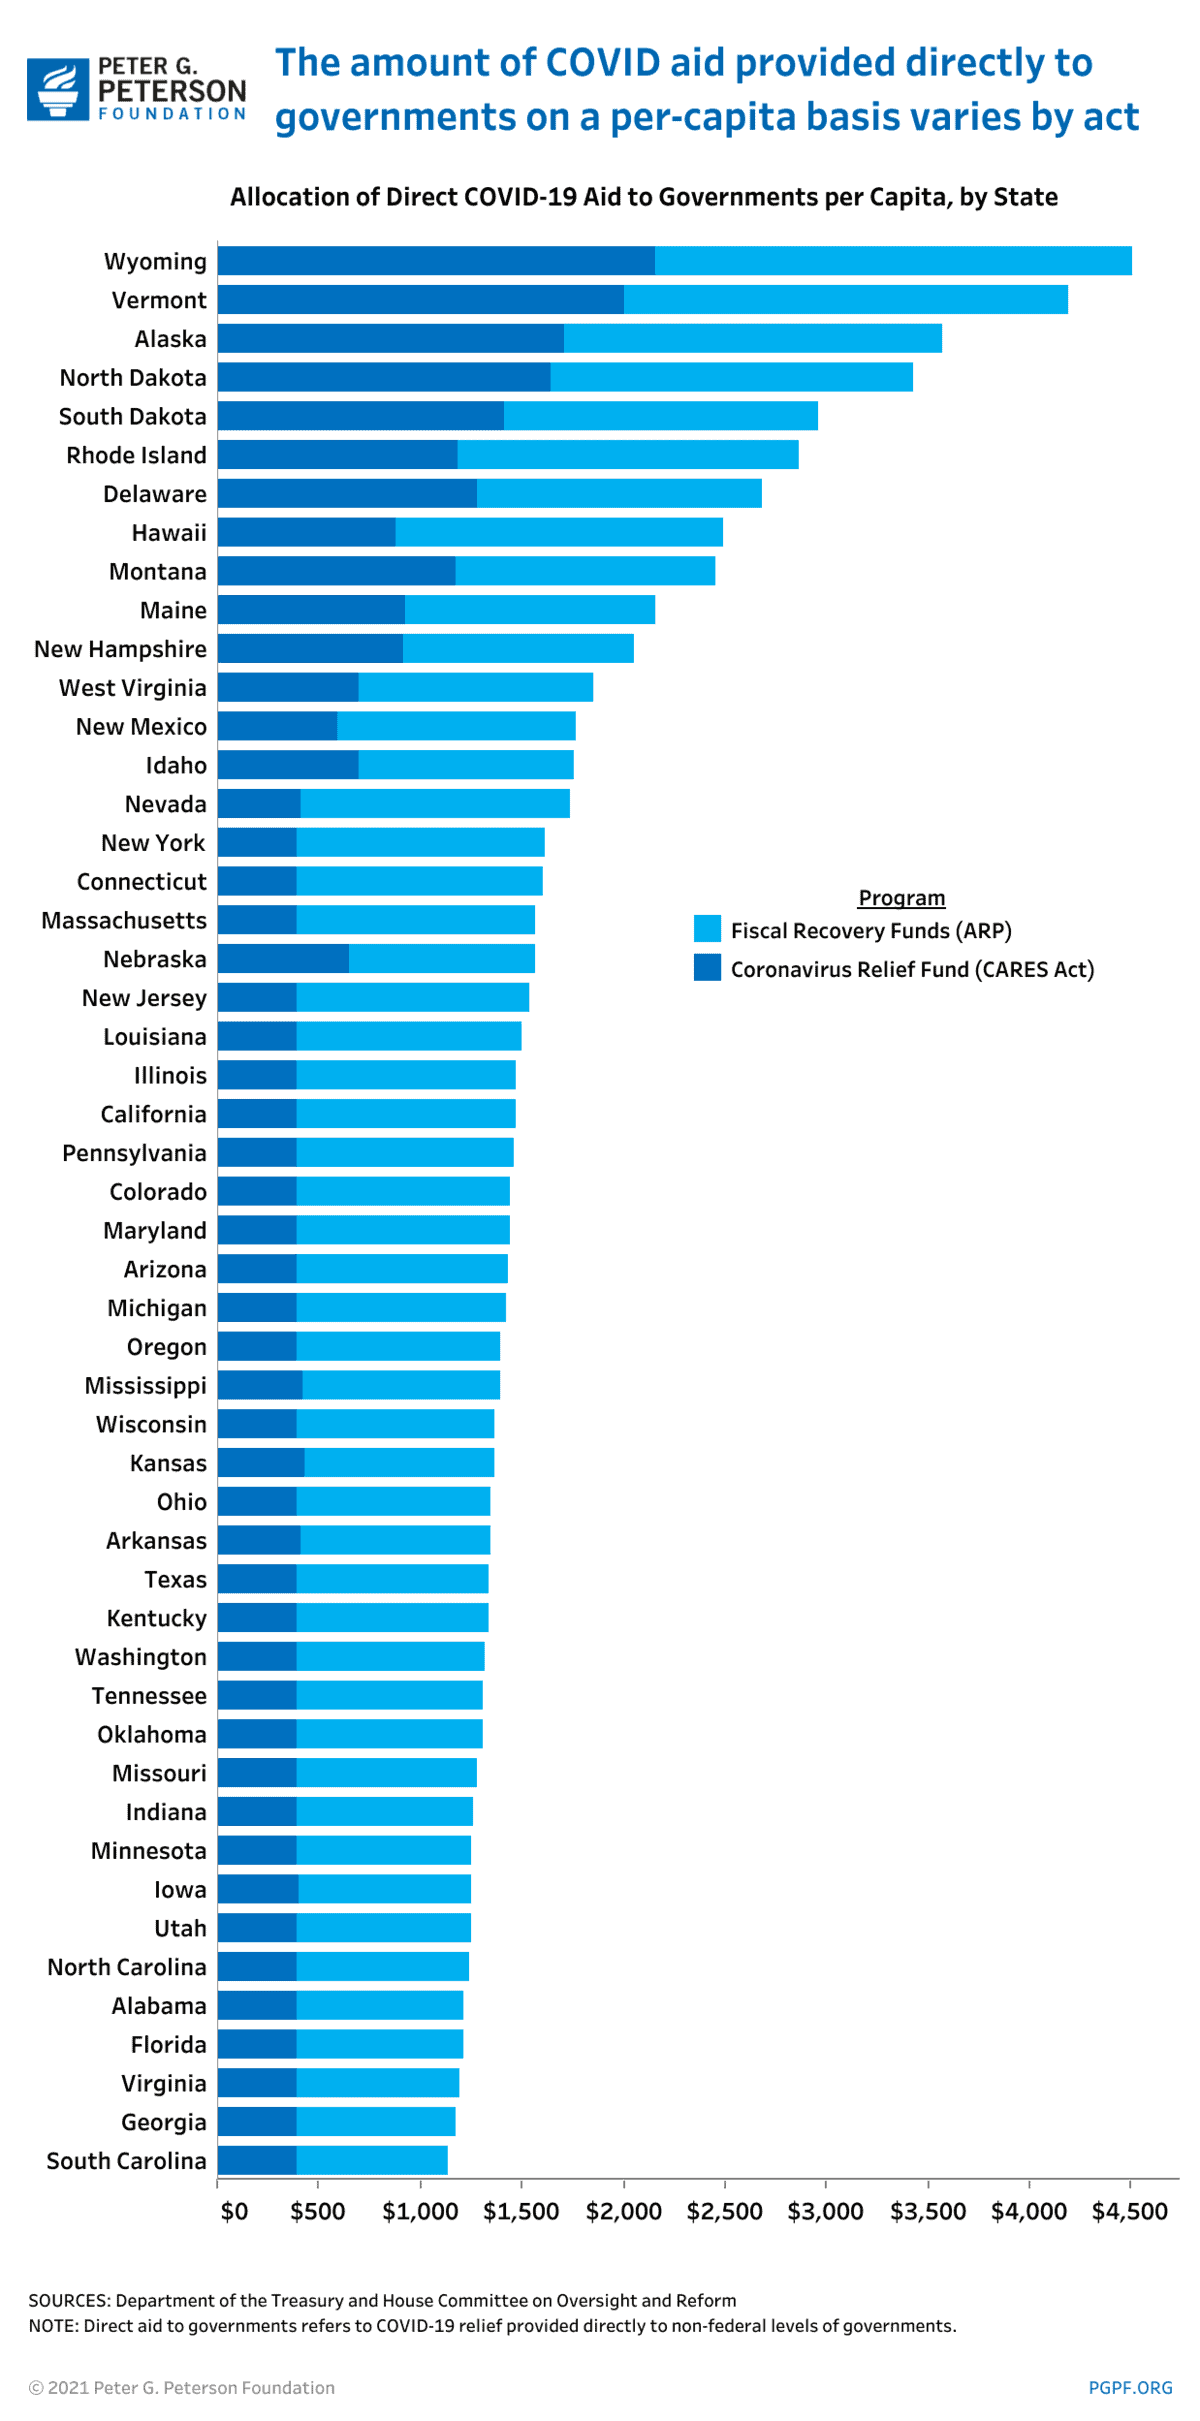
The amount of funding received by each state on a per capita basis varies for a number of reasons, many of which are due to the design of each individual program. One example is the direct aid allocated to state, local, territorial, and tribal governments through the Coronavirus Relief Fund (the $150 billion program enacted under the CARES Act) and the Coronavirus State and Local Fiscal Recovery Funds (the $362 billion program enacted under the American Rescue Plan, or ARP). The funding for both of those programs was guided by formulas that allocated more funding to smaller states, on a per-capita basis, than they did larger states.
The Coronavirus Relief Fund provided direct aid to governments based on population but it required that smaller states receive at least $1.25 billion regardless of their population size. As a result, a group of 29 large and mid-sized states (such as Florida, California, Georgia, and Illinois) received $388 per capita from that program whereas smaller states received up to 5.6 times more — with Wyoming ($2,160) and Vermont ($2,003) receiving the most.
On the other hand, the Coronavirus State and Local Fiscal Recovery Funds, which have yet to be disbursed, will allocate funding largely based on each state’s level of unemployment, instead of its population, and will impose a lower minimum of $500 million per state. Since that second iteration of the program provides nearly 2.5 times as much funding, the per-capita amount should increase for many states — those 29 large and mid-size states that received $388 per capita from the first version of the program are now expected to receive an average of $980 per capita from the State and Local Fiscal Recovery Funds. However, smaller states such as Wyoming ($2,349) and Vermont ($2,185) are still expected to benefit the most from second iteration of the program — receiving about 9 percent more funding from the Recovery Funds than from the Relief Fund — partially due to the minimum funding amount imposed by the legislation.

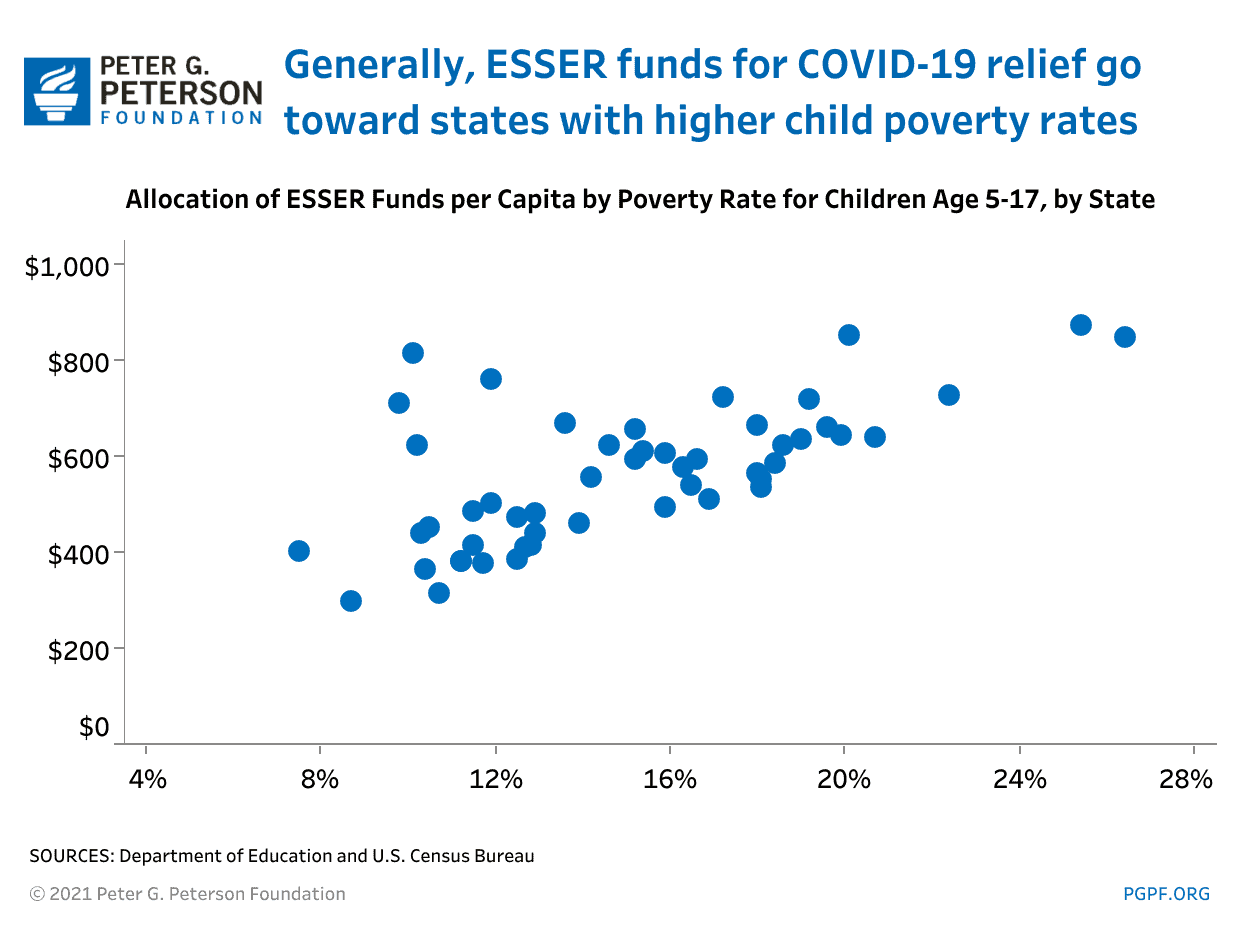
Another example is the aid allocated to provide educational support. About $277 billion has been allocated for such support through the CARES Act, Coronavirus Supplemental Appropriations Act, and the ARP. The majority of that support, $191 billion, comes from the Elementary and Secondary School Emergency Relief (ESSER) Fund; all COVID-19 relief bills allocated that funding on a similar basis. The amount each state received was based on its share of allocations under Title I, Part A of the Elementary and Secondary Education Act — which provides grants to local educational agencies and schools with high numbers or high percentages of children age 5–17 from low-income families — from the most recent fiscal year. Because the allocation of ESSER funds is based on those grants, states with high child poverty levels may receive more ESSER funds per capita relative to other states. Mississippi, Louisiana, and Washington, DC received the most funding through the program and have the first, second, and fifth-highest poverty rates for children age 5–17 respectively. However, those Title I grants also impose a “small state minimum” so certain states may also receive more ESSER funding relative to their levels of child poverty. Vermont and Wyoming, for example, ranked ninth and fourth respectively in terms of ESSER funds per capita but have the third- and fourth-lowest child poverty rates for children age 5–17.

Looking Ahead
The gross and per-capita funding provided through the programs explored above are merely illustrations as to why COVID-19 relief aid may differ by state. As that support continues to be allocated and disbursed across various programs, and the data for those programs are made available, there may be additional opportunities to assess and analyze how funds were targeted and received — and their effectiveness in meeting their stated goals.
Image credit: Photo by Spencer Platt/Getty Images
Further Reading
Should We Eliminate the Social Security Tax Cap?
There have been a number of proposals to increase, eliminate, or otherwise adjust the payroll tax cap as a way to shore up Social Security’s finances.
No Taxes on Tips Will Drive Deficits Higher
Here’s how this new, temporary deduction will affect federal revenues, budget deficits, and tax equity.
Three Reasons Why Assuming Sustained 3% Growth is a Budget Gimmick
GDP growth of 3 percent is significantly higher than independent, nonpartisan estimates and historically difficult to achieve.


