Blog Posts
Nov 7, 2014
National Ad Campaign: "More"
The new campaign highlights the key opportunity lawmakers have to address our nation's unsustainable long-term debt.

The search found 85 results in 0.383 seconds.
The new campaign highlights the key opportunity lawmakers have to address our nation's unsustainable long-term debt.
Up to Us provides an opportunity for college students to raise awareness and engagement on America's long-term fiscal and economic challenges.
https://www.pgpf.org/blog/highlights-from-the-2014-up-to-us-campus-competition
A new report examines pension reform efforts in developed countries across the globe.
https://www.pgpf.org/blog/new-report-csis-lessons-abroad-us-entitlement-debate
These charts illustrate some of the biggest fiscal policy stories from 2017.
https://www.pgpf.org/blog/2017/12/ten-charts-that-sum-up-this-year-in-fiscal-news
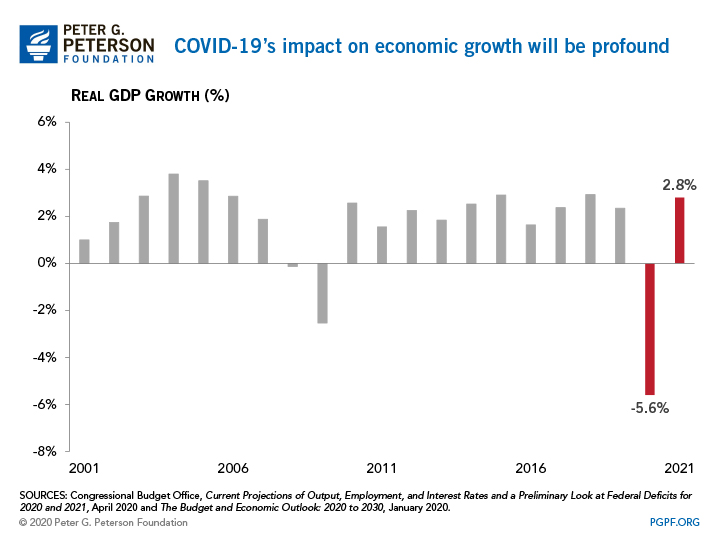
The new numbers demonstrate the severe economic damage and significant fiscal implications of this unprecedented crisis.
Here are five key takeaways from CBO’s latest projections that show the path of federal revenues, spending, and debt through 2050.
https://www.pgpf.org/blog/2020/09/new-cbo-report-pandemic-accelerates-existing-fiscal-challenges
Independent analyses agree unanimously that either bill would add significantly to the growing national debt.
https://www.pgpf.org/blog/2017/12/poll-voters-say-that-tax-reform-shouldn%E2%80%99t-grow-the-debt
PGPF has released a new infographic that illustrates the results from this year's Solutions Initiative III project on stabilizing our long-term fiscal outlook.
https://www.pgpf.org/blog/new-pgpf-infographic-solutions-do-exist
CBO updated its budget projections this week, confirming that for the first year since 2009, deficits as a share of GDP are on the rise again.
https://www.pgpf.org/blog/2016/08/three-key-takeaways-from-the-updated-budget-projections

Here are eleven charts that tell America’s fiscal story for 2019 — and show how our outlook went from bad to worse over the last 12 months.
https://www.pgpf.org/blog/2021/07/11-charts-that-show-how-our-national-debt-grew-in-2019