You are here
Obama's Final Budget: A Missed Opportunity to Put the Nation's Budget on a Long-Term Sustainable Path

Today, President Obama released his final budget outlining the Administration’s policy proposals, budgetary projections, and economic forecasts for the next decade. Although President Obama’s budget keeps the debt from rising as a share of the economy over the next ten years, it does not sufficiently address the key drivers of our long-term, unsustainable debt.
Under the president’s budget:
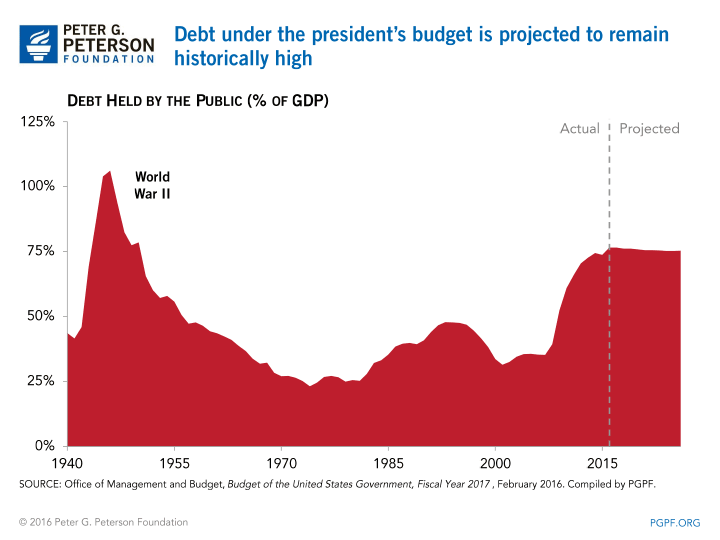
- Federal debt will remain historically high, approximately double its average over the past 50 years.
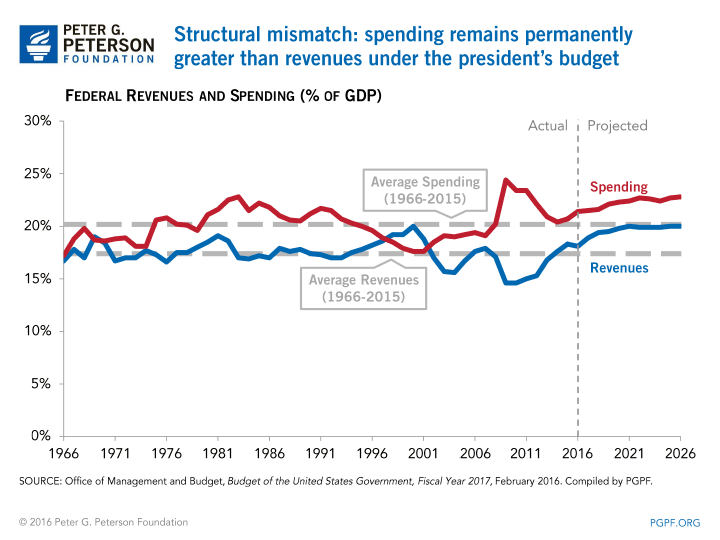
- Revenues and spending will rise significantly — well above their historical averages.
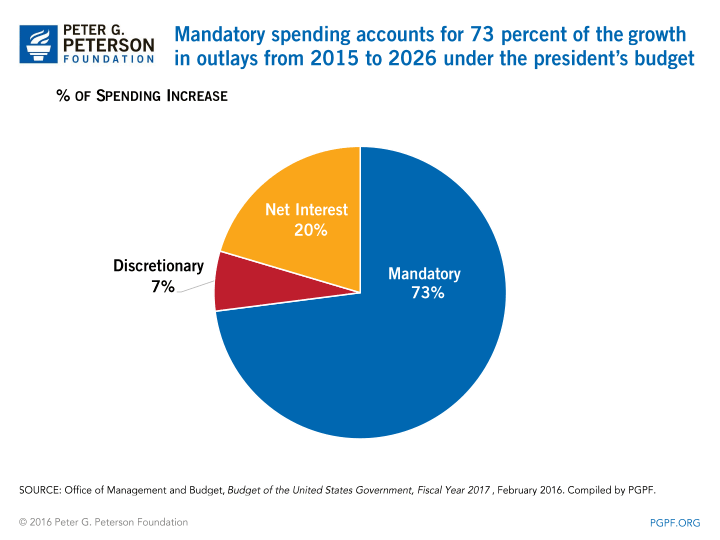
- Mandatory spending will continue to grow as a share of the federal budget — accounting for 73 percent of the growth of outlays from 2015 to 2026.
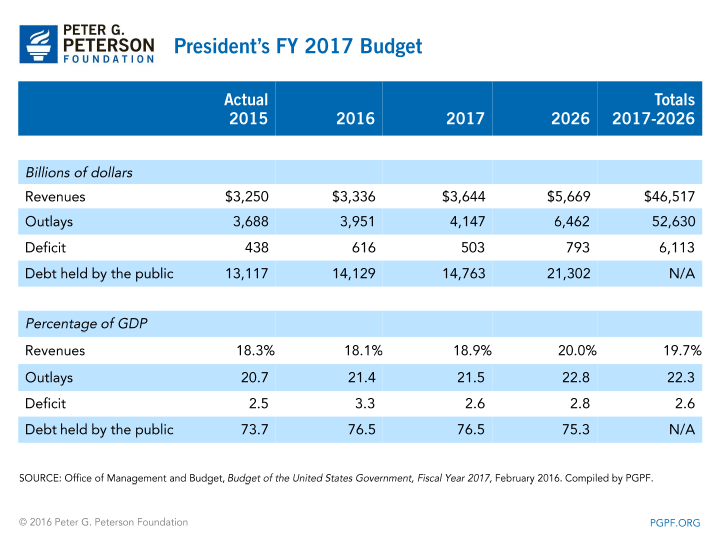
- The structural mismatch between revenues and outlays results in a 10-year deficit of $6.1 trillion and continues indefinitely over the long term.
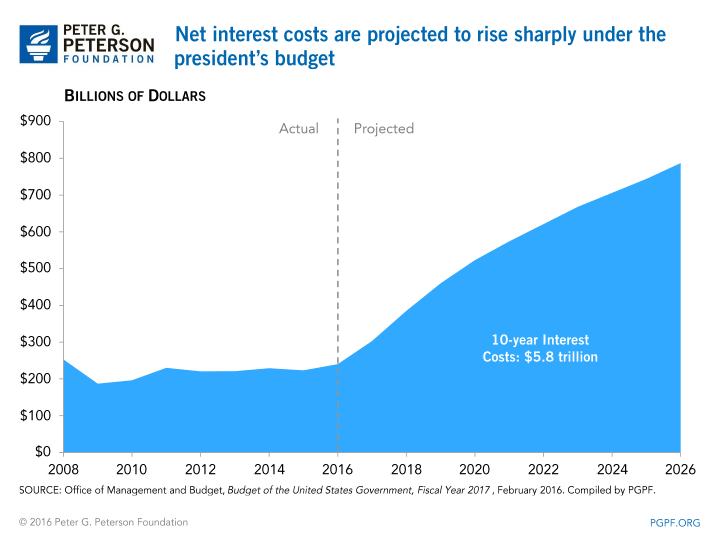
- Annual net interest costs will more than triple from current levels to $787 billion by 2026, and will total $5.8 trillion over ten years.
The 2016 election season is a perfect opportunity for a conversation between voters and candidates about America’s fiscal and economic future. Each candidate should present to the American public their ideas about how to address the nation’s fundamental long-term budgetary challenges. Any serious plan should stabilize our long-term debt with policies that help our economy, make our tax code more efficient, and secure a sustainable economic and fiscal future.
Debt will remain high. Federal debt under the president’s budget is projected to stay at historically high levels, remaining greater than 75 percent of GDP — roughly twice its 50-year average — in each year for the next 10 years. Prior to 2012, debt had never been above 70 percent of GDP except for a few years during and just after World War II. And over the past 50 years, it has averaged just 39 percent of GDP.
Revenues and outlays rise significantly above their historical averages. The president’s budget raises revenues significantly over the next 10 years. Under his plan, revenues will climb to 20.0 percent of GDP by 2026; the 50-year average is 17.4 percent. Outlays will rise to 22.8 percent of GDP in 2026; the 50-year average is 20.2 percent.
Even with the significant increase in revenues proposed by the president, the structural mismatch between revenues and outlays results in a cumulative 10-year deficit of $6.1 trillion — $439 billion greater than the 10-year deficit in the president’s budget last year.
Mandatory programs become an increasing share of the budget. Mandatory spending rises significantly under the president’s budget, nearly doubling from $2.3 trillion in 2015 to $4.3 trillion in 2026. (Mandatory spending includes programs such as: Social Security, Medicare, Medicaid, health insurance subsidies, unemployment assistance, earned income tax credits, and retirement programs for federal employees and members of the military.) In fact, mandatory spending is responsible for the vast majority of the increase in overall spending in the president’s budget, accounting for 73 percent of the growth from 2015 to 2026.
Net Interest Costs Soar. As debt continues to accumulate and interest rates rise, the president’s budget shows interest costs climbing sharply over the next decade. Over the next 10 years, annual net interest costs would more than triple, reaching $787 billion in 2026 and totaling $5.8 trillion from 2017 through 2026.
Discretionary programs are under pressure. As interest payments and spending on mandatory programs grow, the resources available for other important federal activities are constrained. As a share of the total budget, spending on interest payments and mandatory programs will climb to 79 percent in 2026, up sharply from 62 percent in 2006. Discretionary spending will drop to 21 percent of total outlays in 2026, down from 38 percent in 2006 — this includes programs for national defense, homeland security, food and drug safety, science, education, national parks, affordable housing, and infrastructure.
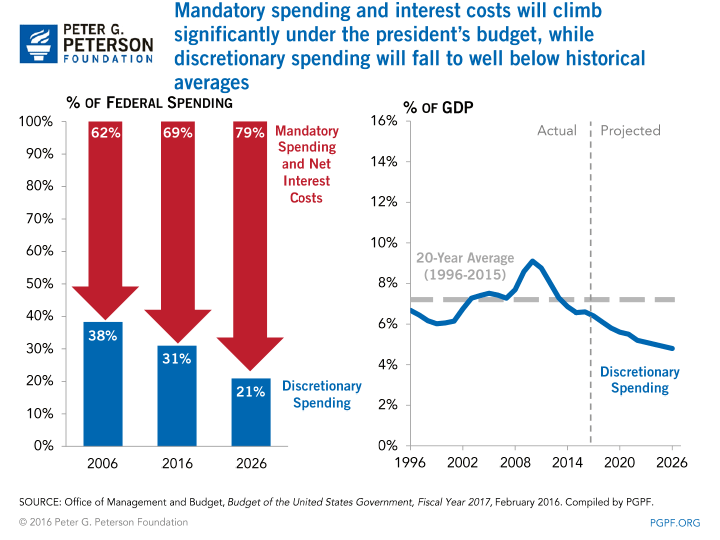
Under the president’s plan, total discretionary spending as a percentage of GDP is estimated to fall from 6.6 in 2016 to 4.8 percent in 2026, 33 percent lower than the 20-year historical average of 7.2 percent. As a result, programs related to R&D, education, infrastructure, and other investments could face funding shortfalls, which could have a negative impact on the economy.
Long-term fiscal challenges remain. The president’s budget does not address the fundamental drivers of our long-term debt — the structural mismatch between revenues and spending continues indefinitely, entitlement and interest spending grow more rapidly than revenues, and the nation remains on a dangerous and unsustainable path.
The long-term fiscal challenges facing the nation are serious. In its most recent Long-Term Budget Outlook report, CBO projected that debt could climb to as much as 175% of GDP in 2040 — more than double the current level of 74 percent. This level of debt would have serious economic consequences to the nation; CBO warned that these levels of debt:
"...would have significant negative consequences for the economy in the long term and would impose significant constraints on future budget policy. The projected amounts of debt would reduce the total amounts of national saving and income in the long term; increase the government’s interest payments, thereby putting more pressure on the rest of the budget; limit lawmakers’ flexibility to respond to unforeseen events; and increase the likelihood of a fiscal crisis."
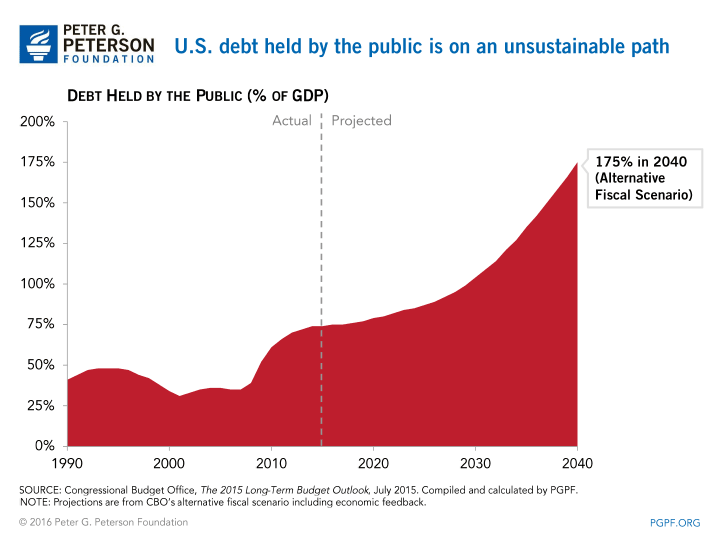
Stabilizing the debt over the long term is an essential element of any sound fiscal policy and viable economic strategy for America. Until we confront these budgetary realities and close the structural imbalance between spending and revenues, America’s economy and future prosperity are at risk. We need to address America’s long-term fiscal challenges in order invest in our own future, to protect critically important programs, and ensure economic growth and opportunity for younger generations.
With election season in full swing, it is time for the presidential and congressional candidates to present their ideas for addressing our nation’s fundamental budget challenges. Any serious plan should put our budget on a long-term sustainable path and provide a stable foundation for economic growth.
