You are here
The Congressional Budget Office's 2012 Long-Term Budget Outlook: An Analysis
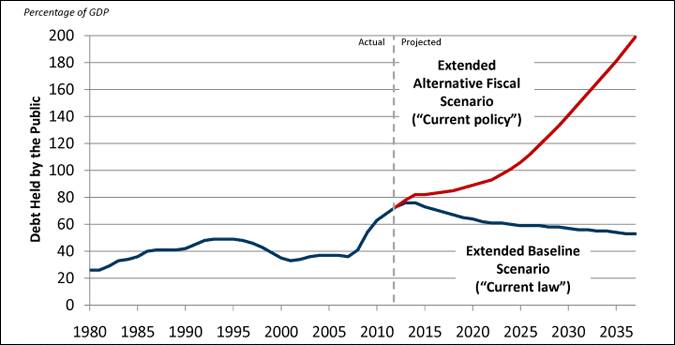
The Congressional Budget Office’s (CBO) new update of its long-term fiscal outlook highlights the continued long-term pressures on the federal budget from the aging of the population and rapid growth in health care costs. These pressures will sharply push up spending on Social Security, Medicare and Medicaid. Under current spending and tax policies, federal debt would be on a path that climbs to about 200 percent of gross domestic product (GDP) within 25 years, according to CBO. If debt climbs to those levels, it will crowd out productive investment, slow the growth of productivity and wages, increase the risk of a fiscal crisis, and damage our economy.
Although the deficit-reduction measure passed last summer—the Budget Control Act of 2011—improved the budget outlook modestly over the next 10 years, CBO found that it did little to change the long-run trajectory of federal debt. Last year, CBO projected that debt would reach 187 percent of GDP in 2035 if current policies are not changed: This year, the agency projects that debt would reach the same level in 2036—only one year later.
CBO recently warned about the economic risks of a "fiscal cliff" facing the nation at the end of 2012 and beginning of 2013 when, under current law, taxes will rise sharply and spending will be reduced. Although these changes would significantly reduce the deficit and slow the accumulation of public debt over the long run, CBO forecasts that they also would push the economy back into recession in the first half of 2013. At the same time, the agency also finds that simply extending the tax cuts and postponing spending cuts indefinitely would cause debt to soar to unsustainable—and harmful—levels over the next 25 years.
Thus, policymakers need to navigate between two risks: cutting too much from the deficit over the next year or two, and cutting too little once the economy recovers. CBO's long-term scenarios highlight the difficult transition before us and the need to find a package of policy changes that address our long-term structural deficits without hurting the recovery. Our current tax and spending policies are not sustainable over the longer term. Yet, given the current fragility of the economy, a sudden shift to a more responsible fiscal path is likely to be counterproductive.
The sensible solution is for policymakers to agree now on a balanced bipartisan plan that implements reductions in our long-term structural deficits later when the economy has recovered.
HIGHLIGHTS
If current policies continue, CBO projects debt will more than double as a percentage of GDP over the next 25 years. Under current law, debt will decrease.
SOURCE: Data from the Congressional Budget Office, The 2012 Long-Term Budget Outlook, June 2012. Compiled by PGPF.
Assuming no changes to current policies, CBO's analysis shows that:
- Federal debt is projected to surpass 90 percent of GDP within a decade, continue to rise to about 200 percent of GDP by 2037 and reach almost 230 percent of GDP by 2040.
- Those rising debts would reduce the total income in the economy in 2037.CBO estimates that this reduction ranges between 3.5 percent and 21 percent from its potential level with the midpoint being a 13.4 percent reduction in personal income.
- Interest on the debt would soar to 10 percent of GDP by 2037 and become the single largest item in the federal budget.
- Spending on Social Security and the major federal health programs will account for all of the growth in noninterest outlays over the next 25 years. Four-fifths of that growth is attributed to the growth in health care costs.
- Social Security is projected to increase by more than one-third and gross spending[i] on the major federal health programs would more than triple by 2087. Together they are projected to consume 25 percent of GDP in 2087—a quarter of the nation’s total economic output—up from 10 percent today.
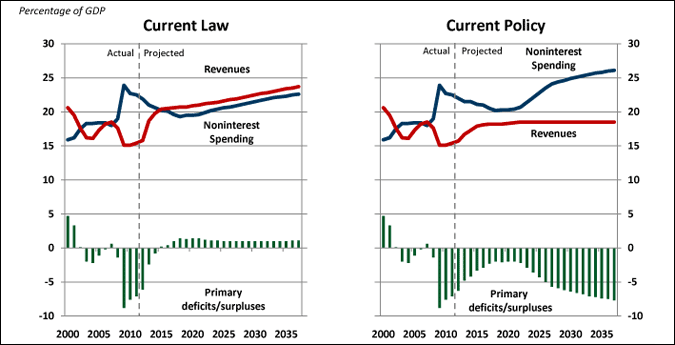
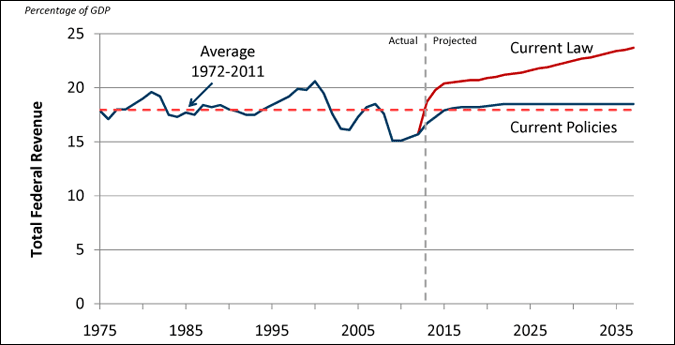
- As the economy recovers, revenues are expected to return to 18.5 percent of GDP—modestly above their average level of the past 40 years—and remain there.
- Closing the fiscal gap over the next 75 years only with spending cuts would require policymakers to slash all spending by 31 percent; closing it only with revenues would require tax hikes of 46 percent.
Summary of current law and current policy scenarios
Percentage of GDP
|
|
2012 | 2022 | 2037 |
|---|---|---|---|
|
Current Law: Extended Baseline Scenario
|
|||
|
Revenue
|
15.8 | 21.2 | 23.7 |
|
Spending
|
23.4 | 22.4 | 25.3 |
|
Deficits
|
7.6 | 1.2 | 1.6 |
|
Debt Held by the Public
|
73 | 61 | 53 |
|
Current Policy: Extended Alternative Fiscal Scenario
|
|||
|
Revenue
|
15.7 | 18.5 | 18.5 |
|
Spending
|
23.4 | 24.3 | 35.7 |
|
Deficits
|
7.7 | 5.9 | 17.2 |
|
Debt Held by the Public
|
73 | 93 | 199 |
SOURCE: Data from the Congressional Budget Office, The 2012 Long-Term Budget Outlook, June 2012. Compiled by PGPF.
FISCAL ASSUMPTIONS IN CBO'S LONG-TERM PROJECTIONS
CBO presents two long-term scenarios to illustrate the uncertainty surrounding long term projections.
The first scenario (the "extended baseline scenario") assumes current law will dictate what policies will go into effect. This scenario assumes that a number of tax policies that have been repeatedly extended by Congress and signed into law by the President will be allowed to expire, that the automatic spending reductions in the BCA are allowed to take effect, and that scheduled reductions to Medicare payments to physicians will also take effect. This scenario puts the budget on a sustainable path over the long term but it would impose sharp changes in the short run—so sharp, in fact, that CBO forecasts that it would push the economy back into recession next year.[ii] This scenario is also implausible because it allows revenue as a share of the economy to grow well above its historical average, assumes much greater spending restraint for health care, and also holds all other federal spending[iii] below its 40 year low level of 8.3 percent of GDP recorded in 1999.
CBO’s second scenario (the "extended alternative fiscal scenario") assumes a continuation of current policy. In that scenario, nearly all of the tax cuts currently scheduled to expire are extended, the alternative minimum tax (AMT) is indexed for inflation, physician payments are not cut, the cost controls in the Affordable Care Act are not maintained after 2022, and the automatic spending cuts imposed by the BCA are overridden. This current-policy scenario would not slow economic growth in the short run, but it would lead to rising public debts in the long run that would damage our economy.
Revenues, spending, and primary deficits under current law and current policy scenarios
SOURCE: Data from the Congressional Budget Office, The 2012 Long-Term Budget and Economic Outlook, June 2012. Compiled by PGPF.
NOTE: Current law is represented by CBO's extended baseline scenario; current policy is represented by CBO's extended alternative fiscal scenario.
THE ECONOMIC IMPACT OF LONG-TERM BUDGET POLICIES
Rising federal debts harm the economy because they crowd out productive capital, slow productivity and wage growth, and raise the risk of a fiscal crisis. That can create a vicious cycle. A weaker economy can make the deficit bigger and the burden of the debt harder to bear.
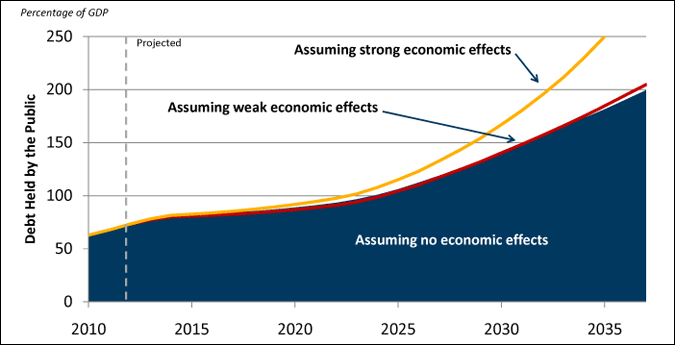
Although CBO’s main projections of the debt do not incorporate the feedback effects between the debt and the economy, the agency looked at them in a separate chapter of its long-term report. If those economic feedbacks are not incorporated in the projections, CBO projects that federal debt would reach almost 200 percent of GDP in 2037 under current policy. However, if those feedbacks are incorporated, federal debt could soar to between 205 percent of GDP to 250 percent of GDP in 2037 and reduce the income per person in that year by between 3.5 percent and 21 percent from its potential level.[iv]
More worrisome is the fact that those estimated feedbacks, if anything, are optimistic because they do not account for the risk of a fiscal crisis. If foreign lenders lost confidence in America's ability to pay back its debt, interest rates would shoot up much more than assumed in CBO’s calculations and push the debt into vicious spiral of even larger deficits, interest costs, higher debt and slower economic growth. In the end, policymakers would face a set of unpleasant options: imposing sudden tax increases and sharp spending cuts, reneging on some of the terms of our debt, and expanding the money supply and allowing the inflation rate to soar.
Under current policy, slower economic growth would increase the projected growth in federal debt
SOURCE: Data from the Congressional Budget Office, The 2012 Long-Term Budget Outlook, June 2012. Compiled by PGPF.
HEALTH CARE
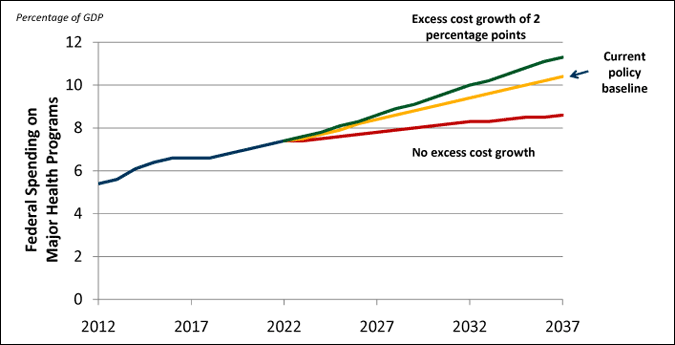
The federal government funds four major health programs: Medicare, Medicaid, Children’s Health Insurance Program (CHIP), and the exchange subsidies created by the Affordable Care Act. CBO projects that total spending on those programs will increase from 5 percent of GDP in 2012 to about 10 percent of GDP in 2037.
The projected growth in federal health care costs stems from two main causes. First, the aging of the population will significantly boost the number of the elderly receiving benefits from Medicare and long-term services from Medicaid. According to CBO, the aging of the population accounts for up to 60 percent of the growth in health care spending through 2037.
Second, health care costs per beneficiary, adjusted for demographic characteristics such as aging, are growing faster than GDP per person. In the past, growth of these so-called "excess health care costs" have stemmed from a variety of factors, including the emergence, adoption and diffusion of new medical technologies and services; the growth of personal income; and, possibly, the expansion of health insurance coverage. Looking forward, CBO anticipates that health spending will continue to be propelled by the growth of excess costs, but it will gradually decrease over time as state and local governments as well as the private sector take actions to control costs.
Health spending grows faster in CBO's current-policy scenario than in its current-law scenario, but the difference is modest. Under either scenario, health spending rounds to 10 percent of GDP in 2037.
Projected spending on major health programs critically depends on excess health care cost growth
SOURCE: Data from the Congressional Budget Office, The 2012 Long-Term Budget Outlook, June 2012. Compiled by PGPF.
NOTE: Excess health care cost growth is the growth of health care cost per beneficiary (adjusted for demographic changes) above the growth of GDP per capita. Current policy baseline is represented by CBO’s extended alternative fiscal scenario.
SOCIAL SECURITY
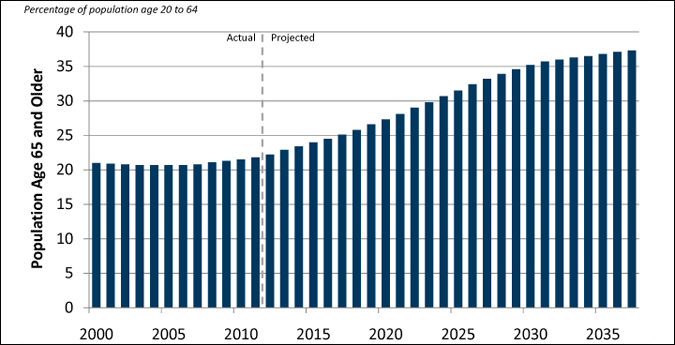
Social Security is currently the single largest program in the federal budget, though, under current policy, Medicare will overtake Social Security in 22 years. CBO estimates that Social Security outlays in 2012 will total $769 billion, or about one-fifth of total federal spending. Over the next 25 years, spending on Social Security will climb as Baby Boomers retire and life expectancy continues to rise.
By CBO's account, the number of people aged 65 and over will increase by almost 90 percent over the next 25 years. As a result, spending on Social Security as a share of GDP will climb by almost 25 percent—from 5 percent of GDP in 2012 to 6.2 percent of GDP in 2037.
The population of the United States is expected to age significantly over the next 25 years
SOURCE: Data from the Congressional Budget Office, The 2012 Long-Term Budget Outlook, June 2012. Compiled by PGPF.
REVENUES
In CBO's current-law scenario, revenues are projected to grow to about 24 percent of GDP in 2037. At that level, they would be well above their historical average of 18 percent of GDP over the last 40 years. However, this scenario assumes the expiration of the tax cuts enacted since 2001 and a decision not to adjust the AMT for inflation. That latter decision would push more than half of the nation’s taxpayers onto the AMT by 2037, up from 3 percent in 2011. Moreover, under this policy, households at all levels of income would pay more tax than similar households do today, according to CBO.
By contrast, revenues under the current-policy scenario would rise to no higher than 18.5 percent of GDP in the long run. At that level revenues would fall well short of spending assumed in the scenario. In 2037, for instance, revenues would be more than 7 percentage points of GDP less than noninterest spending. In today’s economy, that shortfall would amount to $1.1 trillion.
Federal revenue under current policy is assumed to rise to 18.5 percent of GDP, slightly above the average over the last 40 years
SOURCE: Data from the Congressional Budget Office, The 2012 Long-Term Budget Outlook, June 2012. Compiled by PGPF.
CONCLUSION
The Congressional Budget Office's 2012 Long-Term Budget Outlook warns that the nation’s current policy path is unsustainable. The projections highlight the growing mismatch between current spending policies and current revenue policies. As the Baby Boomers reach retirement age, these retirees will put new demands on our nation's entitlement programs and place considerable strain on the nation's finances. At the same time, we have a tax system that inefficient, outmoded and under current policies, will not raise enough revenue to cover the projected increases in spending.
Unless taxes are raised, spending is cut, or both, the federal government will have to issue a massive amount of debt over the next 25 years that would jeopardize the long-run growth and stability of our economy. To keep our deficits and debts from reaching such unsustainable levels, our nation will need to adopt fiscal policies that successfully navigate between the need to protect the recovery of our fragile economy in the short run against the risk of harming it the long run with excessive debt. The sensible solution is for policymakers to agree now on a balanced bipartisan plan that implements reductions in our long-term structural deficits later when the economy has recovered.
[i] Gross spending excludes Medicare premiums and other offsetting receipts.
[ii] Congressional Budget Office, "Estimated Effects of Reducing Fiscal Restraint That Is Scheduled to Occur in 2013." May 2012. Available at http://cbo.gov/publication/43262
[iii] All other federal spending is all spending that is not for Social Security, the major health programs, and net interest.
[iv] In the CBO analysis, potential income is the level of income that could be attained if federal debt were stabilized at about 60 percent of GDP.
