
You are here
The Share of Americans without Health Insurance in 2022 Matched a Record Low
In 2022, 26 million people — or 7.9 percent of the population – were uninsured, according to a report in September 2023 from the Census Bureau. While those numbers represent a significant portion of the population, the uninsured rate in 2022 was the lowest since 2017. Here’s a summary of the latest data to offer insights on how Americans currently get their coverage, how coverage differs across demographic and age lines, how the figures have changed over time, and how key federal programs like Medicare and Medicaid factor in.
Types of Health Insurance Coverage
The Census report also provides significant insights about the state of healthcare access in America during the pandemic. Health insurance is provided through various sources in both the private and public sectors. The Census Bureau defines the programs in each sector:
- Private Insurance includes employment-based insurance plans and plans purchased directly from a marketplace. It also includes TRICARE, which serves members of the military.
- Public Insurance includes Medicare, Medicaid, the Children’s Health Insurance Program (CHIP), and veterans’ health programs.
Uninsured Rates Before the Pandemic
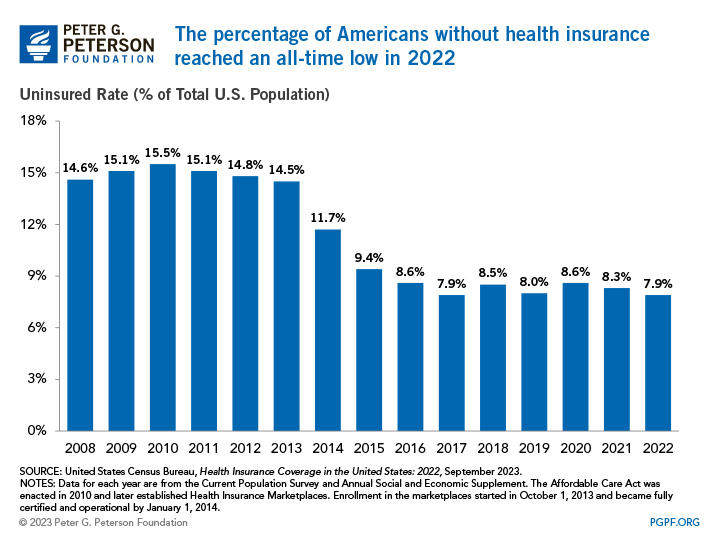
In the decade before the enactment of the Affordable Care Act (ACA) in 2010, the uninsured rate averaged 15.0 percent. In 2014, provisions of the ACA went into effect that enabled states to expand Medicaid eligibility and establish health insurance marketplaces. While outcomes varied by state, those policy changes contributed to a 3.0-percentage-point decrease in the share of uninsured people nationally in the initial year. As additional states adopted Medicaid expansion in the mid-2010s, the uninsured rate continued to drop, falling below 10.0 percent and remaining there since.
Uninsured Rates through 2022
Census data show more people were insured in 2022 than before the pandemic. The number of insured Americans rose by 7.8 million from 2018, the last year of the report before the COVID-19 pandemic impacted data collection, to 2022. That increase was partially due to policies implemented during the pandemic to mitigate its impact, which increased enrollment in public health insurance programs, as well as changes in the labor force. The increased reliance on public health insurance stemmed from the fact many people became eligible for Medicaid and CHIP due to lay-offs and provisions in the Families First Coronavirus Response Act that required states to ensure continuous enrollment. Enrollment in Medicaid and CHIP grew by 29.8 percent from February 2020 to December 2022, reflecting its counter-cyclical design. The COVID-19 Public Health Emergency ended in May 2023, which could affect coverage under certain public programs, such as Medicaid.
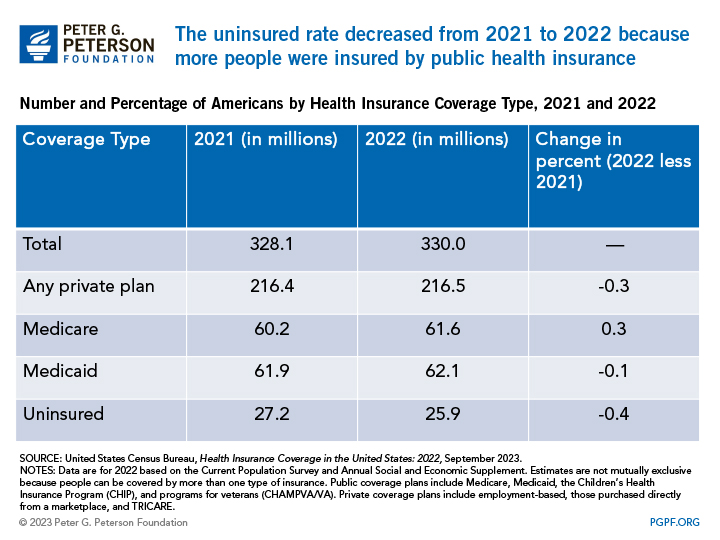
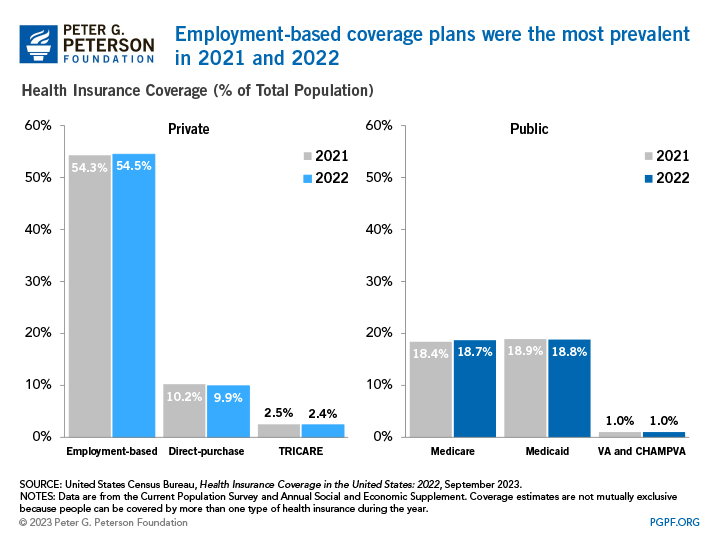
Compared to the prior year, Census data show that the uninsured rate of 7.9 percent in 2022 was meaningfully different than the uninsured rate of 8.3 percent in 2021. The most notable change that contributed to this effect was that the percentage of people covered by public health insurance increased by 0.4 percentage points between 2021 and 2022. Specifically, Medicare coverage increased 0.3 percentage points from 18.4 percent to 18.7 percent over the year, but Medicaid coverage decreased slightly 0.1 percentage point — from 18.9 percent to 18.8 percent. Since 2018, Medicare coverage has increased 0.9 percentage points, and Medicaid coverage has increased 1.1 percentage points. Meanwhile, the percentage of people covered by a private plan decreased slightly from 2021 to 2022, but the overall number of people covered by a private plan increased by 100,000 people.
Public and Private Health Insurance Coverage
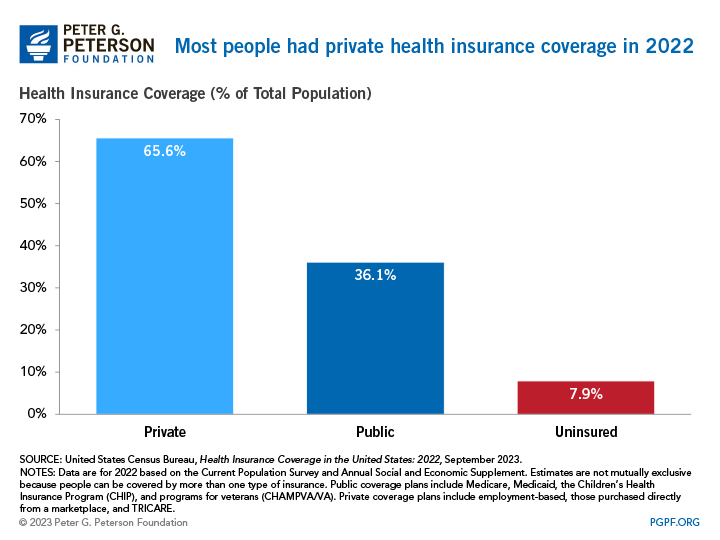
In 2022, private insurance programs covered nearly twice as many Americans as public programs. Of those with health insurance in 2021, 216.5 million people were enrolled in a private program and 119.1 million in a public program. Coverage estimates are not mutually exclusive because people can be covered by more than one type of health insurance during the year, so the sum of those numbers is greater than the U.S. population.
Employment-based plans accounted for more than half of the population with insurance; the next largest sources of coverage were Medicaid and Medicare. There were 179.8 million people covered by employer-sponsored insurance in 2022, which is an increase of 1.5 million from 2021. Compared to 2018, there are 1.4 million more individuals covered by an employer. Meanwhile, 61.6 million individuals were enrolled in Medicare in 2022, up 1.3 million individuals from 2021 and 3.9 million individuals from 2018. Those changes were partly the result of growth in the number of people age 65 and over.
Employment-based plans accounted for more than half of the population with insurance; the next largest sources of coverage were Medicaid and Medicare. From 2018 to 2021, enrollment in employment-based plans declined by about 65,000 people. In the same time period, enrollment in Medicare increased by about 2.5 million individuals, climbing to 60 million in 2021; that change was partly the result of growth in the number of people age 65 and over.
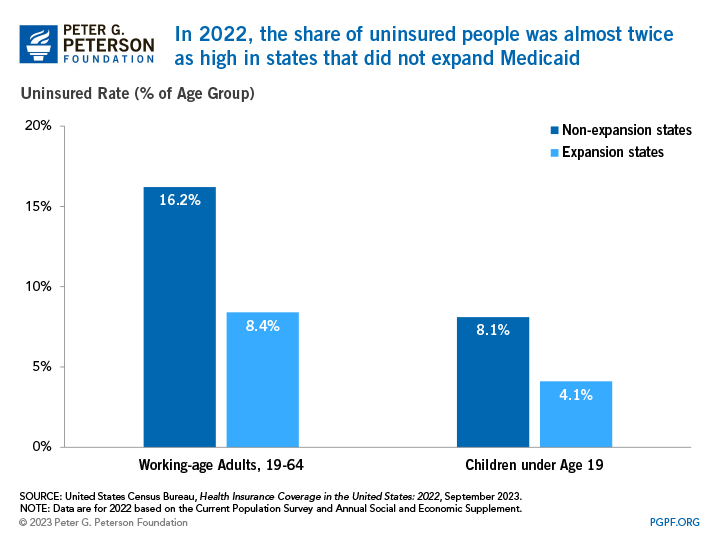
Uninsured rates differ across states and largely depend on whether a state expanded Medicaid eligibility. As part of the ACA, 32 states and the District of Columbia expanded Medicaid eligibility before January 2019. Since then, additional states have adopted a policy to expand eligibility, bringing the total to 41 states and jurisdictions as of today. In 2022, 62.1 million people were covered by Medicaid. Both Medicaid and CHIP provide health insurance coverage for vulnerable populations, including children. In 2022, the average uninsured rate for children in states that expanded eligibility was 4.1 percent, while states that did not expand Medicaid had an average uninsured rate of 8.1 percent. Similarly, a higher proportion of working-age adults were uninsured in states that did not expand Medicaid.
Health Coverage by Age
Every year since the enactment of the ACA, the uninsured rate has been lower for all age groups than it was before its implementation. The uninsured rate for Americans age 65 and older slightly decreased by 0.1 percentage points between 2021 and 2022, but it remains the lowest of any age group as 93.5 percent of such individuals were covered by Medicare in 2022.
In the same time period, the uninsured rate for working-age adults — those between ages 19 and 64 — decreased from 11.6 percent to 10.8 percent. As most individuals in that age group rely on coverage from an employer, the overall decrease was driven by a decline in the uninsured rate among workers. In 2022, 9.8 percent of workers were uninsured, which was 0.9 percentage points less than 2021. That decline occurred for both full-time, year-round workers and less than full-time, year-round workers. The overall uninsured rate for working-age adults is lower than other age groups because of higher costs. According to a Kaiser Family Foundation analysis, 74 percent of uninsured working-age adults in 2019 cited high costs as the reason why they lacked coverage. In states that have not expanded Medicaid eligibility, many working-age adults fall into a “coverage gap,” earning too much to qualify for Medicaid, but not enough to qualify for premium tax credits that make purchasing private insurance in the marketplaces affordable.
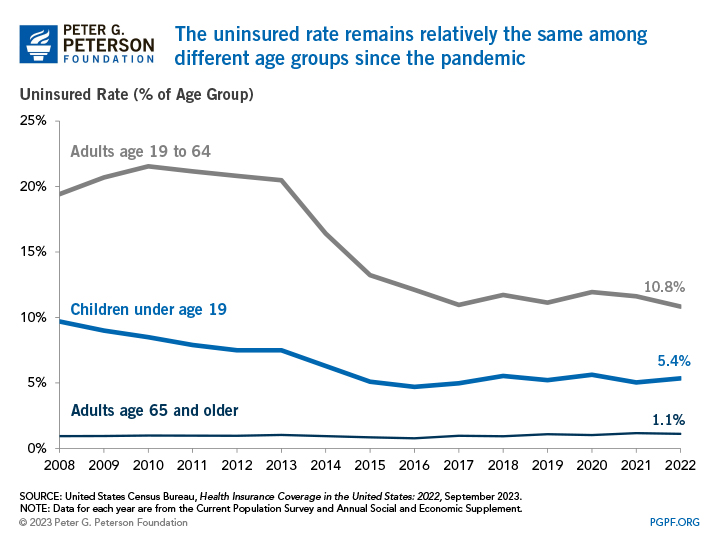
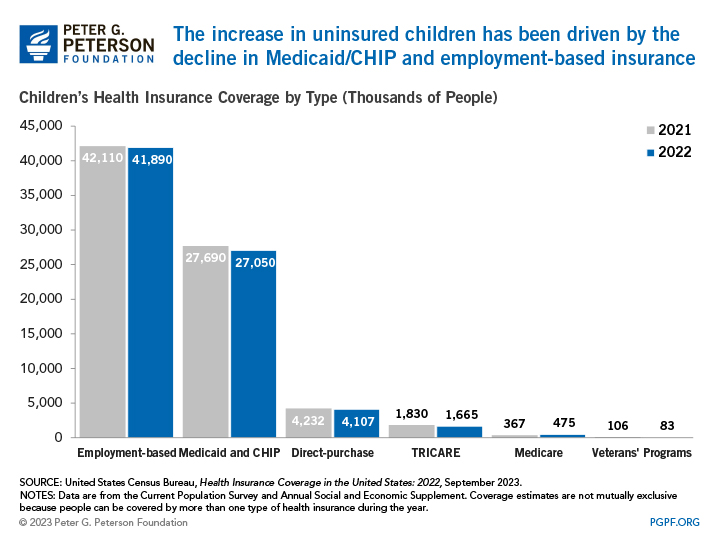
For children under the age of 19, the uninsured rate increased from 5.0 percent in 2021 to 5.4 percent in 2022. The higher uninsured rate is a result of the fact that there was a decrease of 640,000 children who were covered by Medicaid and CHIP, 220,000 fewer children covered by employment-based plans, and 125,000 fewer children covered by a guardian’s direct-purchase plan from 2021 to 2022. Though the uninsured rate increased, it is similar to the uninsured rate of 5.5 percent in 2018 before the pandemic. Changes in enrollment may reflect changes in the economy, changes in policy, and the temporary impact from provisions from coronavirus-related legislation. For example, the temporary continuous enrollment requirement created by the Families First Coronavirus Response Act has reduced the loss of coverage in which enrollees drop out and then re-enroll within a short period of time. From the start of the pandemic in February 2020 to December 2022, enrollment in Medicaid increased by 32.6 percent and CHIP enrollment by 3.1 percent.
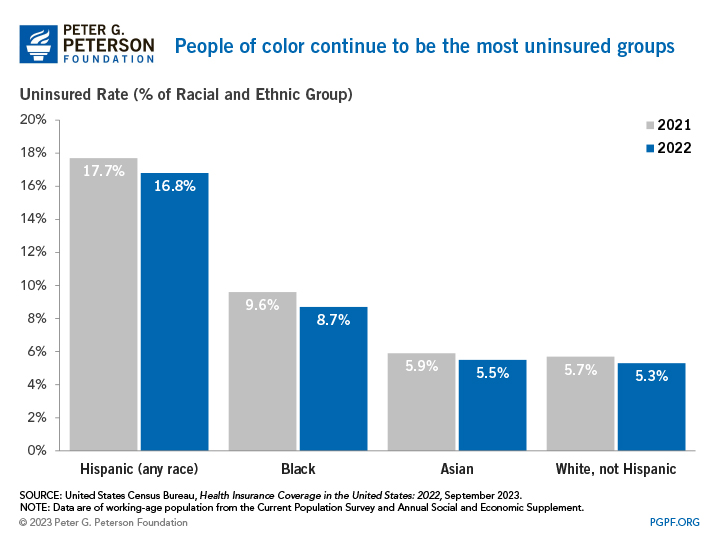
Health Coverage by Race
Heading into the pandemic, non-white Americans had the highest rates of being uninsured. This still holds true in the data from the pandemic, as those are also the groups that have been the most heavily affected by COVID-19 in regard to employment and health. In 2022, 41.6 percent of the population were people of color, but they accounted for 58.3 percent of the uninsured population.
Looking Forward
Though the number has improved significantly over the past decade, 26 million Americans remain uninsured. During the pandemic, the number of uninsured Americans remained relatively stable, in part due to increased eligibility for Medicaid.
Looking ahead, policymakers should continue to work toward policies to improve the efficiency of the U.S. healthcare system, making it more accessible and affordable. Total healthcare spending in the United States is projected to account for nearly one-fifth of the economy by 2031. The federal share of that total is large and growing, which underscores the need to identify and implement solutions to improve healthcare performance in the United States, address a key driver of the federal debt, and better equip individuals to cope with serious threats to public health, such as the coronavirus pandemic.
Related: Why Are Americans Paying More for Healthcare?
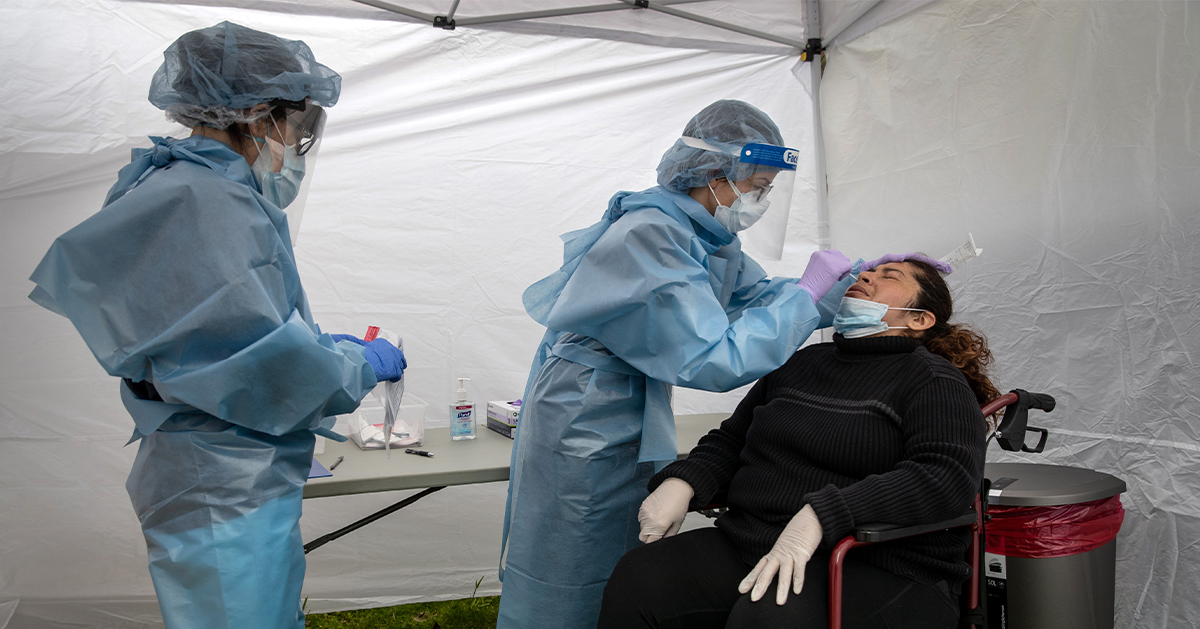
Image credit: John Moore/Getty Images