
You are here
In 2023, the federal government spent $658 billion on net interest costs on the national debt. That total, which grew by 38 percent from $476 billion in 2022, was the largest amount ever spent on interest in the budget and totaled 2.4 percent of gross domestic product (GDP). Interest costs are on track to become the largest category of spending in the federal budget — but what comprises the government’s net outlays on interest, and what affects the size of such costs?
How Much Does the Government Spend on Interest?
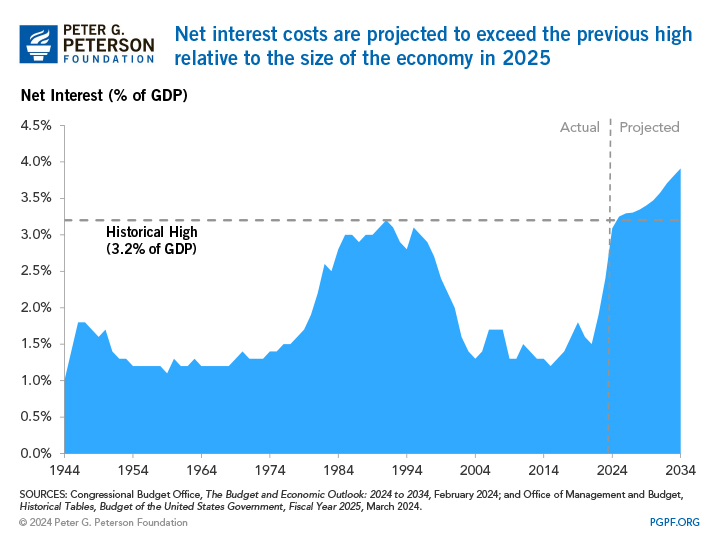
In the late 1970s, the increasing national debt and higher interest rates led to a boost in interest costs, which reached a historic high of 3.2 percent of GDP in 1991 (looking at interest costs as a percentage of the economy allows for a standardized comparison over time). But smaller budget deficits and lower interest rates decreased that ratio over the following decade. Between 2007 and 2020, outlays for interest remained steady at around 1.5 percent of GDP (even though borrowing related to the financial crisis and pandemic was quite high), mostly because of low interest rates. But due to the recent rise in interest rates, as well as the mounting public debt, interest payments have grown rapidly over the past two years, and they are projected to continue growing. The Congressional Budget Office (CBO) projects that interest costs will exceed their previous high relative to the size of the economy, reaching 3.2 percent of GDP ($951 billion) in 2025.
What are the Components of Net Interest Costs?
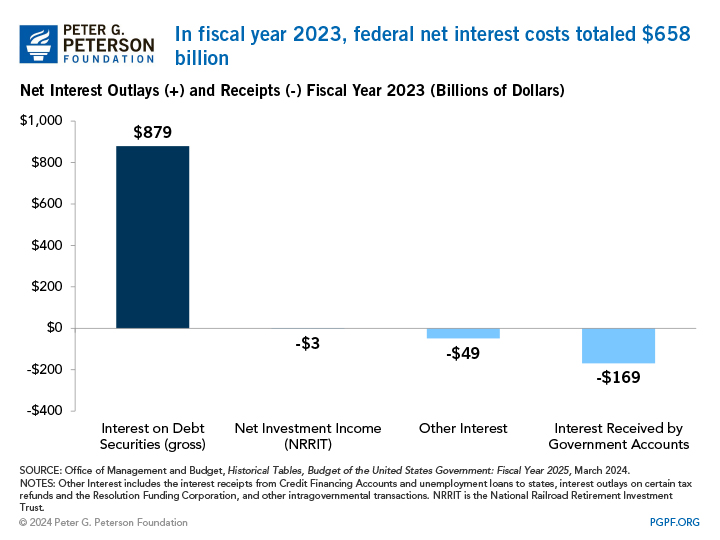
Net interest costs include the interest paid by the government minus the interest and investment income it receives. For the most part, the interest category corresponds to interest paid on debt held by the public; while the government also issues debt to trust funds and other government accounts, interest payments to those entities are intragovernmental transactions and so have no net effect on the overall budget. The government also pays and receives interest through a number of other federal programs, but such sums are relatively small.
Interest Payments
Gross interest outlays mostly reflect payments on debt held by the public as well as intragovernmental payments on debt held by government accounts, primarily the trust funds for Social Security and pensions for retired military and civilian federal workers. Altogether, gross interest totaled $879 billion in 2023. Other examples of programs to which the government pays interest include:
- Tax refunds: The government pays interest on individual, corporate, and excise tax refunds that are paid more than 45 days after the filing date. In 2023, such payments totaled $10 billion.
- Resolution Funding Corporation (REFCORP): REFCORP issued $31 billion in bonds to provide funding for the Resolution Trust Corporation, which was established to help resolve the loan and savings crisis in the 1980s and 1990s. The government paid less than $1 billion in interest on those bonds in 2023. Those payments will cease in 2030, when all REFCORP bonds mature.
Finally, investment earnings and losses from the National Railroad Retirement Investment Trust (NRRIT), an independent entity that manages and invests the assets of the Railroad Retirement program, is recorded in the federal budget in the category of net interest. The trust’s earnings averaged nearly $2 billion in the past decade.
Interest Receipts
Interest receipts come primarily from Treasury securities held by federal trust funds (the interest payments are also recorded in the budget). In 2023, trust funds such as those for Social Security and for pensions of retired federal workers were credited with $169 billion in intragovernmental interest. Similarly, a number of other government accounts, such as the Department of Defense Medicare-Eligible Retiree Health Care Fund, received $24 billion in interest. The federal government also receives interest from other sources:
- Credit Financing Accounts: Credit Financing Accounts are used to track the cash flow of credit programs, such as federal student loans (such programs are recorded in the budget on an accrual basis). In 2023, financing accounts paid a net of $34 billion to the Treasury.
- Unemployment Insurance loans to states: When states do not have enough funds in their state Unemployment Insurance Trust Fund accounts, they may receive certain advances from federal government to pay unemployment benefits and pay interest on those loans. Such receipts totaled less than $1 billion in 2023.
What Are the Drivers of Interest Costs?
The government’s interest costs are mainly determined by the interest rates on U.S. Treasury securities and the amount of debt held by the public.
Interest Rates
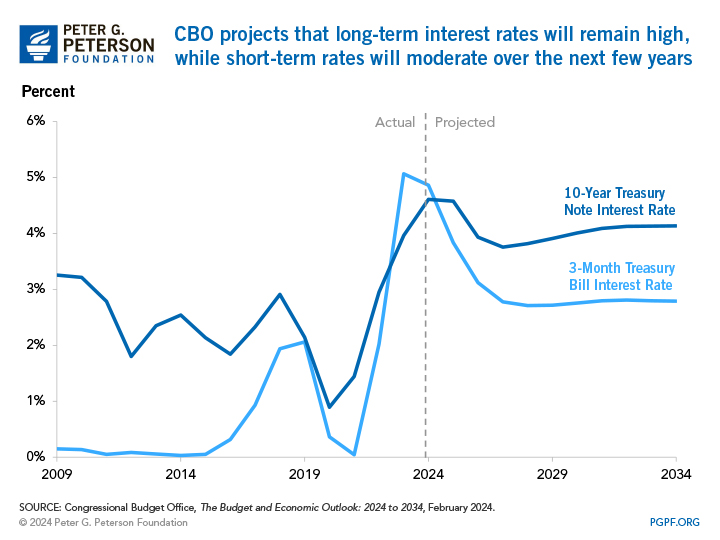
Before the past year or so, short-term interest rates in recent decades were declining or near zero; such rates are generally controlled by the Federal Reserve through the federal funds rate. During the COVID-19 pandemic, the Fed kept the federal funds rate near zero to support economic recovery. However, in response to the significant rise in inflation in 2022, the Fed raised the target range for the federal funds rate (which the Fed uses to moderate interest rates) to between 5.25 and 5.50 percent — a 22-year high. Expectations about short-term interest rates and concerns about inflation have also boosted longer-term rates. According to CBO, short-term interest rates are estimated fall to 2.8 percent by 2027 and average that between 2027 and 2034, but long-term rates will average higher at 4.0 percent over the next decade.
Debt Held by the Public
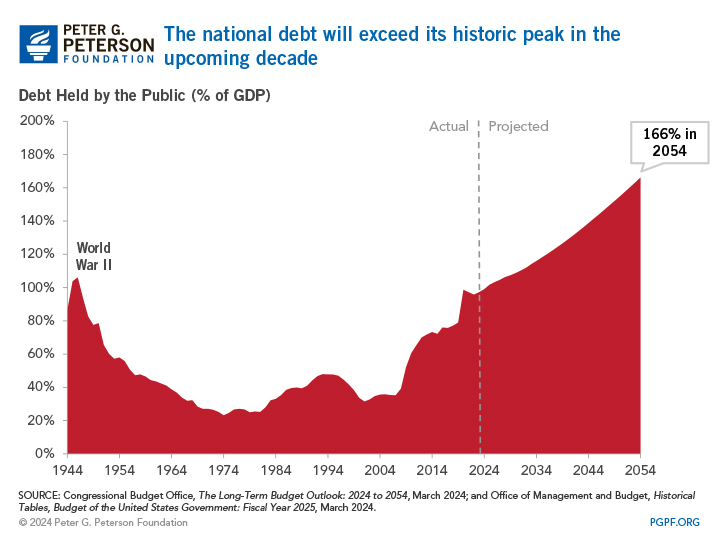
The size of the public debt also influences the government’s net interest costs. The total public debt represents an accumulation of past federal deficits. In all but four years since 1970, the government ran deficits, which caused the national debt to grow at a rapid pace. At the end of fiscal year 2023, debt held by the public totaled $26.2 trillion, or 97 percent of GDP. Under current laws, debt held by the public is expected to reach an all-time high of 106 percent of GDP in just five years and grow to become over one and a half times that size by 2054.
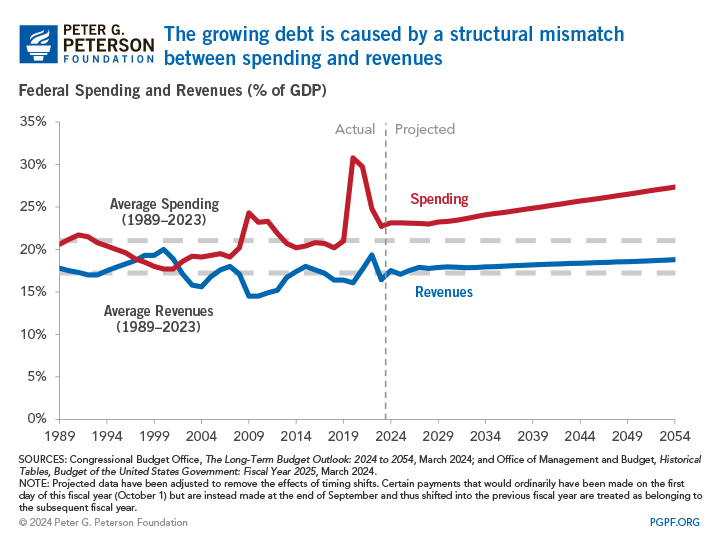
In the past, increases in deficits and the debt were associated with temporary or one-time episodes, such as war or economic downturns. Now, however, deficits have become the norm due to the structural mismatch between federal spending and revenues. CBO estimates that the gap will continue to grow; federal spending is projected to grow from 23.1 percent of GDP in 2024 to 27.9 percent by 2054, while revenues would only climb from 17.5 percent of GDP in 2024 to 18.8 percent in 2054.
What Are the Implications of the Rising Interest Costs?
Rising interest rates and growing national debt cause federal interest costs to rise. And interest costs, in turn, contribute to the growth of federal spending — continuing a vicious cycle of borrowing, interest, and higher debt. Interest costs also crowd out opportunities for investment in other important priorities. In fact, the government is already on a path to spending more on interest costs than its spending on education, research and development, and infrastructure combined. If unaddressed, the growing borrowing costs will pose significant challenges for our nation’s fiscal future.