
You are here
Fiscal Confidence Index: March 2022 Results
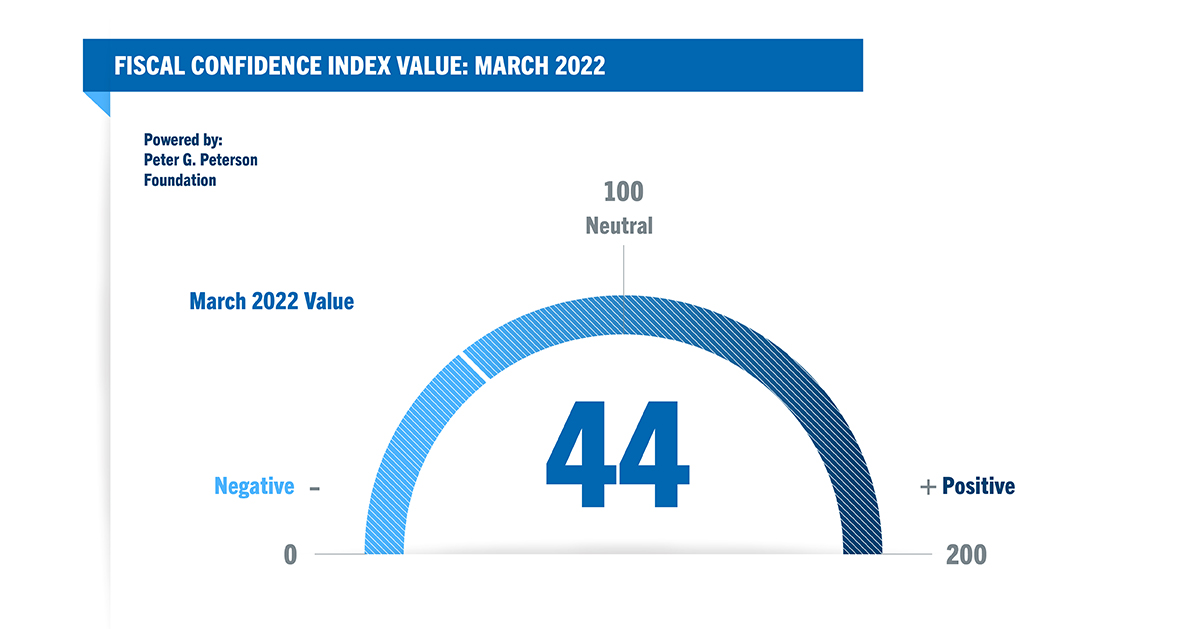
Topline survey results from the Fiscal Confidence Index for March 2022. The FCI value for March is 44.
The Peter G. Peterson Foundation commissioned this poll by the Global Strategy Group and North Star Opinion Research to survey public opinion on the national debt. The online poll included 1,000 registered voters nationwide, surveyed between March 21, 2022 and March 23, 2022. The poll has a margin of error of +/- 3.1%. The poll examined voters’ opinions on the national debt, political leadership, and America’s fiscal and economic health.
The Fiscal Confidence Index value is derived from six questions in three categories: Concern, Priority, and Expectations. The March 2022 scores are: Concern (39), Priority (28), Expectations (66). For the complete methodology used to determine the Fiscal Confidence Index value, click here. For full results, including demographic information, download the PDF below:
Concern (39)
Thinking about our national debt over the last few years, would you say your level of concern has increased or decreased?
Is that a lot or just a little?
| Increased a lot | 55% |
| Increased a little | 28% |
| Decreased a little | 4% |
| Decreased a lot | 2% |
| (No change) | 7% |
| (Don't Know/Refused) | 3% |
| INCREASED (NET) | 83% |
| DECREASED (NET) | 6% |
When it comes to addressing our national debt, would you say things in the United States are heading in the right direction or do you think things are off on the wrong track?
Do you feel that way strongly or just somewhat?
| Right direction - Strongly | 14% |
| Right direction - Somewhat | 20% |
| Wrong track - Somewhat | 25% |
| Wrong track - Strongly | 37% |
| (Neither/Mixed) | 1 |
| (Don't Know/Refused) | 3% |
| RIGHT DIRECTION (NET) | 34% |
| WRONG TRACK (NET) | 61% |
Priority (28)
Some people say that addressing the national debt should be among the President and Congress' top 3 priorities. Do you agree or disagree?
Do you feel that way strongly or just somewhat?
| Strongly agree | 54% |
| Somewhat agree | 22% |
| Somewhat disagree | 14% |
| Strongly disagree | 5% |
| (Don't Know/Refused) | 5% |
| AGREE (NET) | 76% |
| DISAGREE (NET) | 20% |
And when it comes to our national debt, do you think it is an issue that the President and Congress should spend more time addressing or less time addressing?
Would you say a lot (more or less) time or just a little?
| A lot more time | 46% |
| A little more time | 32% |
| A little less time | 8% |
| A lot less time | 5% |
| (The same amount of time) | 4% |
| (Don't Know/Refused) | 5% |
| MORE TIME (NET) | 79% |
| LESS TIME (NET) | 13% |
Expectations (66)
And thinking about our national debt over the next few years, do you expect the problem to get better or worse?
Is that much (better or worse) or just somewhat (better or worse)?
| Much better | 10% |
| Somewhat better | 18% |
| Somewhat worse | 31% |
| Much worse | 35% |
| (No change) | 2% |
| (Don't know/Refused) | 4% |
| BETTER (NET) | 28% |
| WORSE (NET) | 66% |
And when it comes to our national debt, are you optimistic or pessimistic that the United States will be able to make progress on our national debt over the next few years?
Would you say you are very (optimistic or pessimistic) or just somewhat?
| Very optimistic | 8% |
| Somewhat optimistic | 33% |
| Somewhat pessimistic | 30% |
| Very pessimistic | 23% |
| (Neither/Mixed) | 3% |
| (Don't Know/Refused) | 3% |
| OPTIMISTIC (NET) | 41% |
| PESSIMISTIC (NET) | 53% |