
You are here
Fiscal Confidence Index: August 2023 Results
Introduction
In 2012, the Peterson Foundation launched the Fiscal Confidence Index to help policymakers, members of the media, and the American public gauge public opinion on the nation’s fiscal and economic challenges.
The Fiscal Confidence Index is an important indicator of the American public’s views about our fiscal and economic condition and the progress elected leaders are making in addressing it. Since its inception, the Fiscal Confidence Index has consistently shown that Americans hold deep concerns about the level of our long-term debt, and they urge policymakers to make addressing our fiscal and economic future a top priority.
The Fiscal Confidence Index, released monthly, is modeled after the Consumer Confidence Index and measures public opinion about the national debt and the economy by asking questions in three key areas:
- CONCERN: Level of concern and views about the direction of the national debt.
- PRIORITY: How high a priority addressing the debt should be for elected leaders.
- EXPECTATIONS: Expectations about whether the debt situation will get better or worse in the next few years.
The individual scores in these three areas are averaged to produce the Fiscal Confidence Index value.
Check back monthly for updates.
Detailed Results
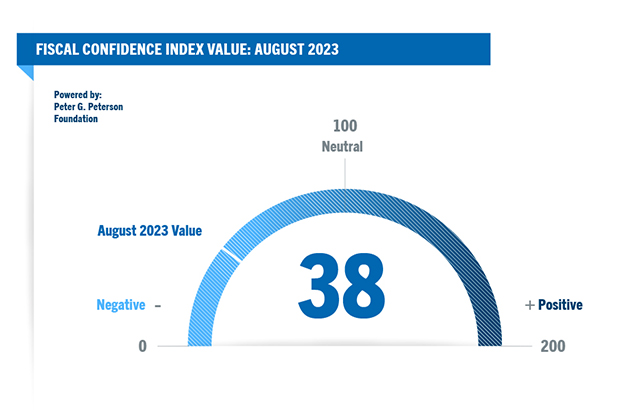
Topline survey results from the Fiscal Confidence Index for August 2023. The FCI value for August is 38.
The Peter G. Peterson Foundation commissioned this poll by the Global Strategy Group and North Star Opinion Research to survey public opinion on the national debt. The online poll included 1,013 registered voters nationwide, surveyed between August 21, 2023 and August 23, 2023. The poll has a margin of error of +/- 3.1%. The poll examined voters’ opinions on the national debt, political leadership, and America’s fiscal and economic health.
The Fiscal Confidence Index value is derived from six questions in three categories: Concern, Priority, and Expectations. The August 2023 scores are: Concern (30), Priority (22), Expectations (62). For the complete methodology used to determine the Fiscal Confidence Index value, click here. For full results, including demographic information, download the PDF below:
Concern (30)
Thinking about our national debt over the last few years, would you say your level of concern has increased or decreased?
Is that a lot or just a little?
| Increased a lot | 53% |
| Increased a little | 31% |
| Decreased a little | 4% |
| Decreased a lot | 2% |
| (No change) | 8% |
| (Don't Know/Refused) | 2% |
| INCREASED (NET) | 84% |
| DECREASED (NET) | 6% |
When it comes to addressing our national debt, would you say things in the United States are heading in the right direction or do you think things are off on the wrong track?
Do you feel that way strongly or just somewhat?
| Right direction - Strongly | 6% |
| Right direction - Somewhat | 23% |
| Wrong track - Somewhat | 27% |
| Wrong track - Strongly | 42% |
| (Neither/Mixed) | * |
| (Don't Know/Refused) | 2% |
| RIGHT DIRECTION (NET) | 29% |
| WRONG TRACK (NET) | 69% |
Priority (22)
Some people say that addressing the national debt should be among the President and Congress' top 3 priorities. Do you agree or disagree?
Do you feel that way strongly or just somewhat?
| Strongly agree | 52% |
| Somewhat agree | 28% |
| Somewhat disagree | 12% |
| Strongly disagree | 4% |
| (Don't Know/Refused) | 4% |
| AGREE (NET) | 80% |
| DISAGREE (NET) | 16% |
And when it comes to our national debt, do you think it is an issue that the President and Congress should spend more time addressing or less time addressing?
Would you say a lot (more or less) time or just a little?
| A lot more time | 53% |
| A little more time | 31% |
| A little less time | 6% |
| A lot less time | 4% |
| (The same amount of time) | 4% |
| (Don't Know/Refused) | 3% |
| MORE TIME (NET) | 84% |
| LESS TIME (NET) | 10% |
Expectations (62)
And thinking about our national debt over the next few years, do you expect the problem to get better or worse?
Is that much (better or worse) or just somewhat (better or worse)?
| Much better | 4% |
| Somewhat better | 21% |
| Somewhat worse | 33% |
| Much worse | 35% |
| (No change) | 3% |
| (Don't know/Refused) | 3% |
| BETTER (NET) | 25% |
| WORSE (NET) | 68% |
And when it comes to our national debt, are you optimistic or pessimistic that the United States will be able to make progress on our national debt over the next few years?
Would you say you are very (optimistic or pessimistic) or just somewhat?
| Very optimistic | 4% |
| Somewhat optimistic | 37% |
| Somewhat pessimistic | 34% |
| Very pessimistic | 18% |
| (Neither/Mixed) | 4% |
| (Don't Know/Refused) | 3% |
| OPTIMISTIC (NET) | 42% |
| PESSIMISTIC (NET) | 52% |
For Press
NEW YORK — A new Peter G. Peterson Foundation poll reveals that vast majorities of Americans across the political spectrum want lawmakers to avoid a federal shutdown. Voters are increasingly concerned about the economic damage created by political brinksmanship and the interruption of government services. In addition, the U.S. Fiscal Confidence Index fell two points this month to 38 (100 is neutral).
Read the Full FCI Press Release for August 2023
For media inquiries please call (212) 542-9200 or jrosen@pgpf.org.
Methodology
The Fiscal Confidence Index will be released monthly by the Peter G. Peterson Foundation.
The Fiscal Confidence Index value is based on six questions in three categories.
As is done with the Consumer Confidence Index, the first step in calculating the Fiscal Confidence Index is determining the "Relative Value" for each question. This calculation is made by taking the positive response for each question and dividing it by the sum of the positive and negative responses. Each question was asked on a four-point scale, and answers were weighted according to intensity, with the strongest responses counting twice as much as the middle responses ("much" better or worse answers count twice as heavily as "somewhat" better or worse answers).
The scores for the Concern, Priority, and Expectations categories are determined by averaging the scores derived from the two questions in each category.
The Fiscal Confidence Index value is converted from the Relative Value to place it on a scale on which 100 indicates equal positive and negative sentiment, while values below 100 indicate negative sentiment and values above 100 indicate positive sentiment.